Working with Sets and Venn Diagrams
Sets are simply collections of items. A set may contain your favorite even numbers, the days of the week, or the names of your brothers and sisters. The items contained within a set are called elements, and elements in a set do not “repeat”.
The elements of a set are often listed by roster.
A roster is a list of the elements in a set, separated by commas and surrounded by French curly braces.
For information on other methods of describing sets, see Set-Builder and Interval Notation.

The empty set is denoted with the symbol: Ø = { }
The empty set is a subset of every set.
Sets are often represented in pictorial form with a circle containing the elements of the set. Such a depiction is called a Venn Diagram.
A Venn diagram is a drawing, in which circular areas represent groups of items usually sharing common properties. The drawing consists of two or more circles, each representing a specific group or set. This process of visualizing logical relationships was devised by John Venn (1834-1923).
Each Venn diagram begins with a rectangle representing the universal set. Then each set of values in the problem is represented by a circle. Any values that belong to more than one set will be placed in the sections where the circles overlap.
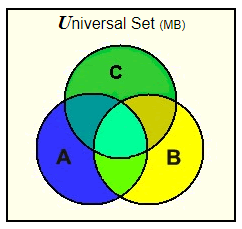
The universal set is often the “type” of values that are solutions to the problem. For example, the universal set could be the set of all integers from -10 to +10, set A the set of positive integers in that universe, set B the set of integers divisible by 5 in that universe, and set C the set of elements -1, – 5, and 6.
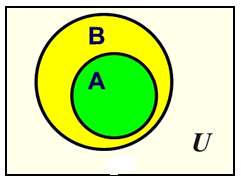
If set A is contained within set B, then set A is a subset of set B. All of the elements in set A are also elements of set B.
Notation: A⊆B means A is a subset of B and A may be equal to B (they may be the same set).
A⊂B means A is a proper subset of B (these is at least one element of B which is not in A).
Some authors use the ⊂ symbol for both “subset” and “proper subset”.
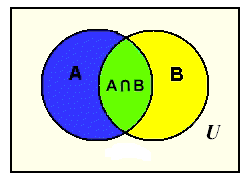
The Venn diagram below shows two sets A and B that overlap. The universal set is U. Values that belong to both set A and set B are located in the center region labeled A ∩ B where the circles overlap. This region is called the “intersection” of the two sets.
![]()
(Intersection, is only where the two sets intersect, or overlap.)
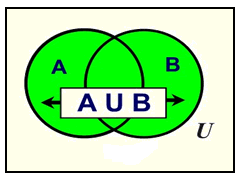
The Venn diagram below shows two sets A and B that overlap. The notation A ∪ B represents the entire region covered by both sets A and B (and the section where they overlap). This region is called the “union” of the two sets.
![]()
(Union, like marriage, brings all of both sets together.)
The Venn diagram below shows two sets A and B that do not overlap. Sets that do not overlap, are called mutually exclusive.
The union of these two sets is the set of elements that are in set A along with the set of elements that are in set B. ![]()
( “Union” is the blending of both sets.)
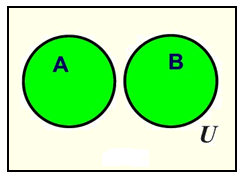
If we cut out sets A and B from the picture above, the remaining region in U, the universal set, is labeled, (A ∪ B)c and is called the complement of the union of sets A and B.
A complement of a set is all of the elements (in the universe) that are NOT in the set.
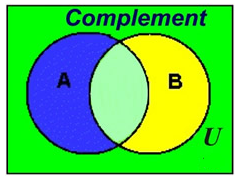

Example:
Let U (the universal set for this example) = {1, 2, 3, 4, 5, 6, 7, 8, 9, 10}
Let A = {2, 4, 6, 8}
Let B = {1, 2, 3, 4, 5}
A ∪ B = {1, 2, 3, 4, 5, 6, 7, 8} Union – ALL elements in BOTH sets
A ∩ B = {2, 4} Intersection – elements where sets overlap
Ac = {1, 3, 5, 7, 9, 10}Complement – elements NOT in the set
Bc = {6, 7, 8, 9, 10}
** One of the most interesting features of Venn diagrams is the areas or sections where the circles overlap one another — implying that a sharing is occurring.
This ability to represent a “sharing of conditions” makes Venn diagrams useful tools for solving complicated problems. Consider the following example:
Example: Twenty-four dogs are in a kennel. Twelve of the dogs are black, six of the dogs have short tails, and fifteen of the dogs have long hair. There is only one dog that is black with a short tail and long hair. Two of the dogs are black with short tails and do not have long hair. Two of the dogs have short tails and long hair but are not black. If all of the dogs in the kennel have at least one of the mentioned characteristics, how many dogs are black with long hair but do not have short tails?
Solution: Draw a Venn diagram to represent the situation described in the problem.
Represent the number of dogs that you are looking for with x.
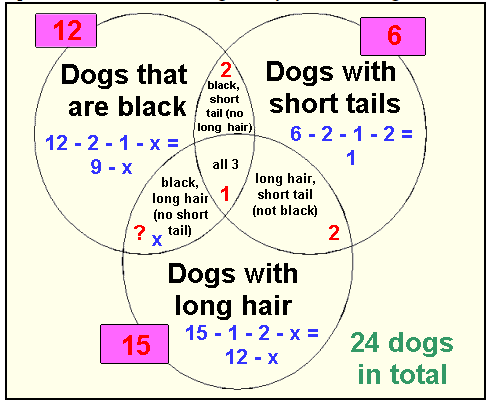
- Notice that the number of dogs in each of the three categories is labeled OUTSIDE of the circle in a colored box. This number is a reminder of the total of the numbers which may appear anywhere inside that particular circle.
- After you have labeled all of the conditions listed in the problem, use this OUTSIDE box number to help you determine how many dogs are to be labeled in the empty sections of each circle.
- Once you have EVERY section in the diagram labeled with a number or an expression, you are ready to solve the problem.
- Add together EVERY section in the diagram and set it equal to the total number of dogs in the kennel (24). Do NOT use the OUTSIDE box numbers.
- 9 – x + 2 + 1 + 1 + 2 + x + 12 – x = 24
- 27 – x = 24
- x = 3 (There are 3 dogs which are black with long hair but do not have a short tail.)
