Quartiles and Box and Whisker Plots
When describing a set of data, without listing all of the values, we have seen that we can use measures of location such as the mean and median. It is also possible to get a sense of the data’s distribution by examining a five statistical summary (or five number summay), the (1) minimum, (2) maximum, (3) median (or second quartile), (4) the first quartile, and (5) the third quartile. Such information will show the extent to which the data is located near the median or near the extremes.

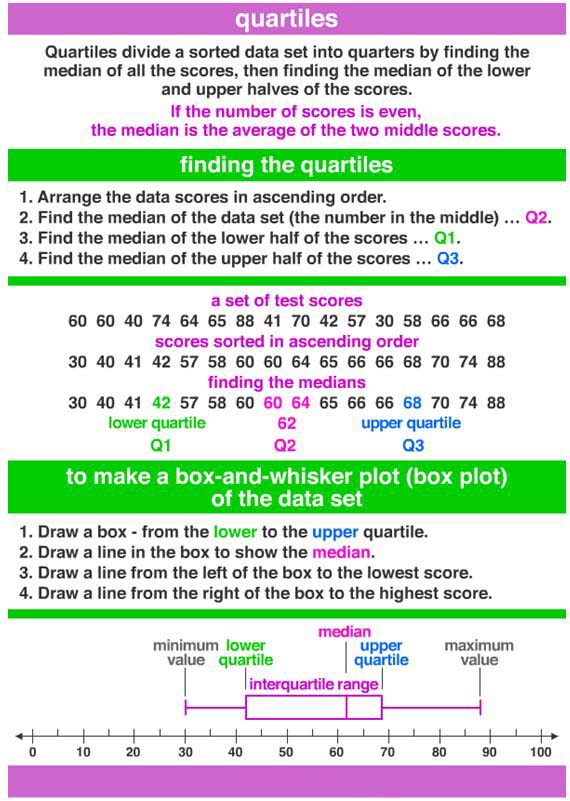
Quartiles
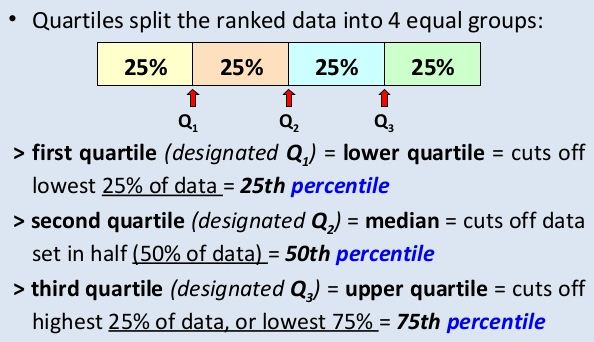
We know that the median of a set of data separates the data into two equal parts. Data can be further separated into quartiles. Quartiles separate the original set of data into four equal parts. Each of these parts contains one-fourth of the data.
Quartiles are percentiles that divide the data into fourths.

A quartile is a number, it is not a range of values. A value can be described as “above” or “below” the first quartile, but a value is never “in” the first quartile.
 Consider: Check out this five statistical summary for a set of tests scores.
![]()
While we do not know every test score, we do know that half of the scores is below 80 and half is above 80. We also know that half of the scores is between 70 and 90.
(The difference between the third and first quartiles is called the interquartile range.)
A five statistical summary can be represented graphically as a box-and-whisker plot.
The first and third quartiles are at the ends of the box, the median is indicated with a vertical line in the interior of the box, and the maximum and minimum are at the ends of the whiskers.

Box-and-whisker plots are helpful in interpreting the distribution of data.
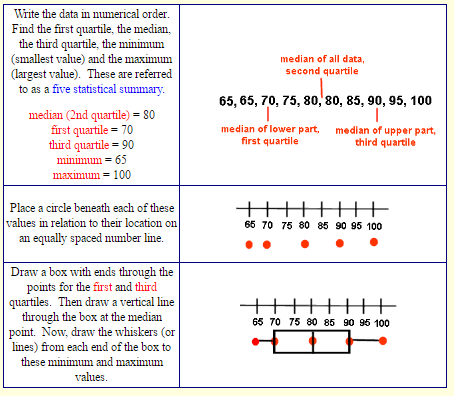
How to construct a box-and-whisker plot:
Construct a box-and-whisker plot for the following data:
The data: Math test scores 80, 75, 90, 95, 65, 65, 80, 85, 70, 100

Special Case:
You may see a box-and-whisker plot, like the one below, which contains an asterisk.

Sometimes there is ONE piece of data that falls well outside the range of the other values. This single piece of data is called an outlier. If the outlier is included in the whisker, readers may think that there are grades dispersed throughout the whole range from the first quartile to the outlier, which is not true. To avoid this misconception, an * is used to mark this “out of the ordinary” value.
