Kerala Plus Two Microeconomics Chapter Wise Questions and Answers Chapter 2 Theory of Consumer Behaviour
Plus Two Economics Theory of Consumer Behaviour One Mark Questions and Answers
Question 1.
Suppose a consumer’s preferences are monotonic. Which bundle of goods the consumer will select over the bundle (15,15), (10,12) and (12,12).
Answer:
Consumer prefers the bundle (15,15) over the other bundles.
Question 2.
In drawing an individual demand curve, all but one of the following are kept constant.
(a) Price of the commodity
(b) Price of other commodities
(c) Income of the consumer
(d) Taste and preference of the consumer
Answer:
(b) Price of other commodities
Question 3.
Find out economic terms.
- Bundles that are on or below the budget line.
- Consumer prefers the bundle which has more of the goods compared to the other bundle.
- A group of indifference curves.
Answer:
- Budget set
- Monotonic preferences
- Indifference map
Question 4.
Slope of indifference curve shows.
(a) Price ratio (rule)
(b) DMRS
(c) DMU
(d) None of these
Answer:
(b) DMRS
Question 5.
In the case of inferior goods, the relationship between income and quantity demanded in.
(a) negative
(b) positive
(c) constant
(d) cannot be predicted
Answer:
(a) negative
Question 6.
Elasticity in a rectangulas hyperbola is:
(a) 0
(b) a
(c) 1
(d) 0.5
Answer:
(c) 1
Question 7.
Rise in demand due to fall in price is called:
(a) Increase in demand
(b) Expansion of demand
(c) Contraction of demand
(d) Decrease in demand
Answer:
(b) Expansion of demand
Question 8.
If demand falls from 100 to 75 units due to rise in price from 10 to 15, the value of elasticity is…
(a) 1
(b) 0.5
(c) 0
(d) 2
Answer:
(b) 0.5
Plus Two Economics Theory of Consumer Behaviour Two Mark Questions and Answers
Question 1.
Suppose Raju is indifferent to bundles (8,7) and (7,7). Are the preferences of Raju are monotonic?
Answer:
No, if his preferences are monotonic, he will prefer the bundle (8,7) over (7,7).
Question 2.
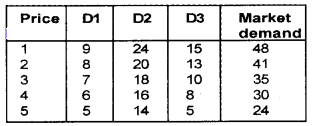
Consider a market where there are 3 consumers and suppose their demands for the good are given as follows:
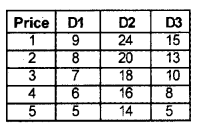
Calculate the market demand for the good.
Answer:
Question 3.
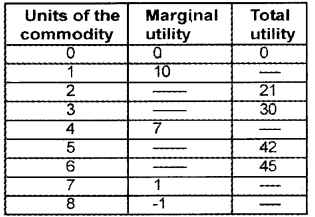
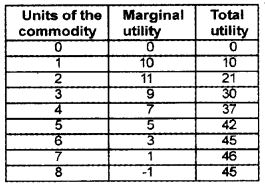
Complete the following table.
Answer:
Question 4.
Pick out the odd one and justify your answer. Bread and butter, Pen and Ink, Butter and Jam, Tennis ball and Tennis racket.
Answer:
Butter and Jam. Others are complementary goods.
Question 5.
State the law of demand. Test the applicability of the law in the status symbol goods.
Answer:
Law of demand – “other things remaining the same as the price of a commodity falls, its quantity demanded increases and vice versa”.
Certain ostentatious goods like luxury cars; diamonds, etc. are exceptions to the law of demand. These goods are considered as status symbol goods consumed by the rich. The status goes up as price increases. Therefore, the demand for these goods increases as their price increases.
Question 6.
The demand function of a commodity is Q = 30 – 2 P. If it is a free good, quantity demanded would be.
Answer:
If the commodity is a free good, the price = 0
Q = 30 – 2 × 0
= 30 – 0 = 30
Question 7.
When the elasticity of demand for a product is unitary,
- Name the shape of the demand curve?
- Give the value of price elasticity of demand?
Answer:
- Rectangular hyperbola
- Value of price elasticity of demand is unity
Question 8.
Consider the demand curve D(p) = 10 – 3p. What is the elasticity at price 2?
Answer:
D(P) = 10 – 3p
Since P = 2, we get
D(P) = 10 – 3 × 2
= 10 – 6 = 4
Σd = \(\frac{\Delta Q}{\Delta P}=\frac{4}{2}\) = 2
Thus there is elastic demand.
Plus Two Economics Theory of Consumer Behaviour Three Mark Questions and Answers
Question 1.
Suppose a consumer buys bundles of good 1 and good 2. His income is given as ‘M’ and it is fully spent. If the prices of good 1 and good 2 are P1 and P2 respectively, state the consumer’s budget constraint.
Answer:
We assume that the consumer buys bundles of good 1 and good 2. The consumer’s consumption expenditure is limited by his income. Given the prices of good 1 and good 2 as P1 and P2 respectively and his income as ‘M’, consumer’s budget constraint can be represented as P1X1 + P2X2 ≤ M
Question 2.
Match the following
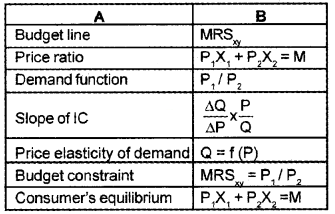
Answer:
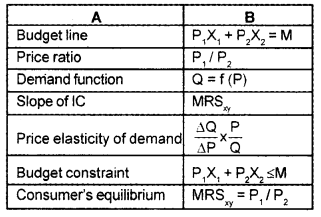
Question 3.
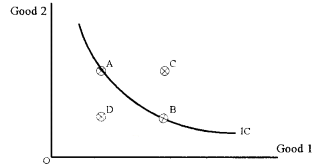
Given below an indifference curve.
- State the meaning of an indifference curve.
- Identify the points A, B, C and D on the 1C.
Answer:
1. An indifference curve shows different bundles that give the consumer the same level of satisfaction. In other words, an indifference curve joins all points representing bundles which are considered indifferent by the consumer.
2. Points A and B are on the indifference curve indicating the same level of satisfaction. Point C lies above the indifference curve representing the preferred bundles. Point D lies below the indifference curve showing the inferior bundles.
Question 4.
Two demand function equations are given below.
QD1 = 60 – 10P
QD2 = 80 -10P
a. Derive two demand schedules forthe above de-mand functions (Take the values of P as 1,2,3,4,5)
QD1= 60- 10P
QD2 = 80 – 10P
P = 1,2,3,4,5
Answer:
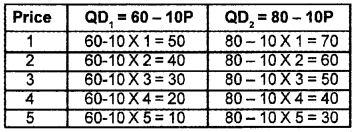
Question 5.
Fora linear demand curve,
d (p) = a – bp; 0 < p < a/b = 0; p> a/b
- State the meaning of ‘a’ and -b?
- What does the slope of the demand curve mean?
Answer:
- In the equation of linear demand curve, ‘a’ is the vertical intercept and-b is the slope of the demand curve.
- The slope of the demand curve measures the rate at which demand changes with respect to its price.
Question 6.
Observe the three budget lines drawn below.
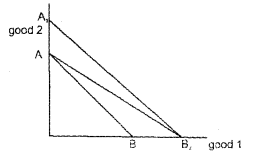
If AB is The Intial Budget Line, What Causes The Shift in budget line.
- from ABtoAB
- from ABtoA
Answer:
- Fall in price of good 1
- A rise in income or fall in prices of both good 1 & good 2.
Question 7.
Choose the correct answer from the given multiple choices.
1. Which of the following goods has more elastic demand?
- Rice
- Computer
- Electricity
- Life-saving drugs
- Salt
2. Identify the nature of demand curve when elasticity of demand is equal to one.
- Perfectly elastic demand
- Rectangular hyperbola
- Parallel to Vertical axis.
- Perfectly inelastic demand
- Parallel to horizontal axis
Answer:
- computer
- rectangular hyperbola
Question 8.
Compare the slope of the budget line and slope of the indifference curve.
Answer:
The slope of the indifference curve shows the rate at which the consumer is willing to substitute with others. Here the substitution is in terms of satisfaction. The slope of the budget line shows the rate at which a consumer is able to substitute our good for others. Here the substitution is in terms of price.
Question 9.
Indicate for each of the following situations whether it would shift the demand curve upward or downward
- The price of substitute falls.
- Consumer’s income increases
- There is sudden rise in population.
- Complementary goods become more expensive.
- There is possibility of further fall in price, nilei
- New cheaper substitutes of the commodity appear in the market.
Answer:
- downward
- upward
- upward
- downward
- downward
- downward
Question 10.
Classify the following goods into two based on their elasticity.
Petrol, medicine, tomatoes, car, garments, salt
Answer:
| Elastic Demand | Inelastic Demand |
| Tomatoes | Petrol |
| Garments | Medicine |
| Car | Salt |
Question 11.
Imagine that you are the finance minister of Kerala. You want to raise more tax revenue. How will you use elasticity in your tax proposals?
Answer:
As finance minister, I will raise taxes on goods like cigarettes, liquor, and luxury products. These goods have inelastic demand and therefore, their demand will not decline in proportion to the price rise. This will help to raise more tax revenue.
Question 12.
Categorize the following into substitutes and complementaries.
Coffee and tea, pen and ink, bread and jam, scooter and petrol, shoes and chappels, airplane and train.
Answer:
1. Substitutes:
- Coffee and tea
- Shoes and chapels
- Airplane and train
2. Complementaries:
- pen and ink
- bread and jam
- scooter and petrol
Question 13.
The price of X falls from ₹8 per unit to t 6. Consequently, the quantity demanded increased from 80 to 100. Calculate the price elasticity of demand.
Answer:
\(\frac{\Delta Q}{\Delta P} \times \frac{P}{2}\)
ΔQ = 20
ΔP = 2
P = 8
Q = 80
ep = \(\frac{20}{2} \times \frac{8}{80}=\frac{160}{160}=1\)
ep = 1
This is unitary elastic demand
Question 14.
State whether true or falls
- The demand curve is generally sloping upward
- Demand for cosmetic is elastic
- Utility is want satisfying power of a commodity
Answer:
- False. Demand curve slops downward.
- True
- True
Question 15.
What do you mean by inferior goods? Give some example?
Answer:
Inferior goods are those goods whose demand decreases with rise in the income and demand increases with the fall in the income.
Question 16.
Give an account of price elasticity of demand.
Answer:
Price elasticity of demand is a measure used in economics to show the responsiveness, or elasticity, of the quantity, demanded of a good or service to a change in its price. It was devised by Alfred Marshall. The formula for the
![]()
The above formula usually yields a negative value, due to the inverse nature of the relationship between price and quantity demanded, as described by the “law of demand”.
This measure of elasticity is sometimes referred to as the own-price elasticity of demand for a good, i.e., the elasticity of demand with respect to the good’s own price, in order to distinguish it from the elasticity of demand for that good with respect to the change in the price of some other good, i.e., a complementary or substitute good. The latter type of elasticity measure is called a cross-price elasticity of demand.
Question 17.
Given the level of income and market prices, the rational consumer wants to attain the maximum level of satisfaction. Using the budget line and indifference curve that you have studied, answer the following questions.
- Construct a diagram showing the consumer’s equilibrium.
- What condition is satisfied at this equilibrium point?
Answer:
1.
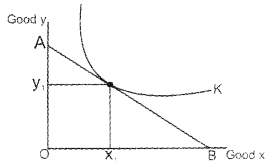
2. Price ratio = Marginal Rate of Substitution
Question 18.
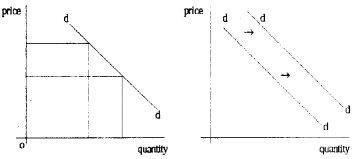
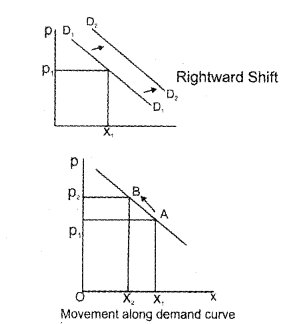
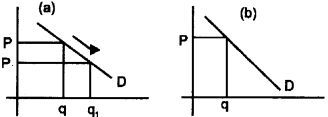
Two diagrams related to demand are given below. What do they represent?
Answer:
- Figure 1 – Movement along the demand curve due to change in price.
- Figure 2 – Shift in demand due to change in non price factor.
Question 19.
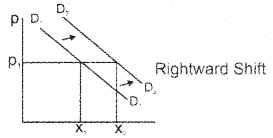
If other things remaining same, graphically explain what happens to the demand curve for chicken if there is
- An increase in the price of fish.
- A decrease in family income.
- An increase in the price of chicken.
Answer:
1.
2.
Plus Two Economics Theory of Consumer Behaviour Four Mark Questions and Answers
Question 1.
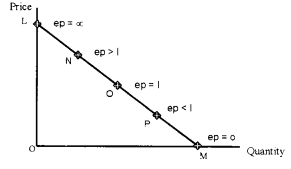
“Price elasticity of demand is different at different points on the linear demand curve” Prove this point diagrammatically.
Answer:
On the linear demand curve, Price elasticity of demand varies from point to point. It can be seen from the linear demand given below. As we move from the higher point to lower point the value of elasticity goes on decreasing.
Question 2.
Locate the optimum bundle of the consumer in a diagram. Also, suggest the conditions for the consumer’s optimum.
Answer:
The optimum bundle of the consumer is located at the point where the budget line is tangent to one of the indifference curves. It is drawn below.
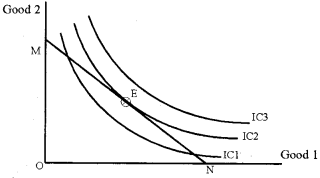
- Condition I: Budget line should be tangent to the indifference Curve
- Condition II: Slope of 1C (MRSxy) should be equal to slope of budget line (Price Ratio)
Question 3.
Draw a demand curve at all points of which price elasticity remains the same. Also, name the demand curve and give the equation for it.
Answer:
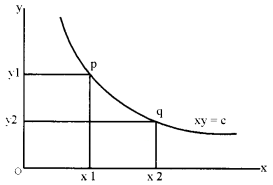
The demand curve at which all points represent same elasticity is called a rectangular hyperbola. The equation is xy = c, where, x and y are two variables and c is a constant. With such a demand curve, no matter at what point, the consumer consumes at a constant rate.
Question 4.
Gopan buys 8 kg of rice at price ₹15 per kg. It is found that the price elasticity of demand is 2. At what price he will buy 13 kg of rice?
Answer:
Price elasticity of demand means the degree of responsiveness of demand due to change in price. The formula for price elasticity of a product is,
Ep = \(\frac{\Delta Q}{\Delta P} \times \frac{P}{Q}\)
Here the price elasticity of demand = 2
\(\frac{\Delta Q}{\Delta P} \times \frac{P}{Q}\) = 2
\(\Delta P=\frac{8.12}{2}\)
ΔP = 4.06
new price is 13 – 4.06 = 8.96
Question 5.
Show how the following changes affect the budget line
Answer:
- Increase in income of the consumer
- Decrease in income
- Fall in the price of good 1
- Rise in the price of good 1
Answer:
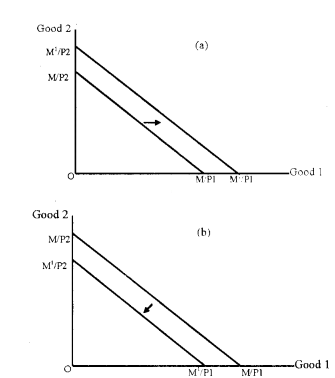
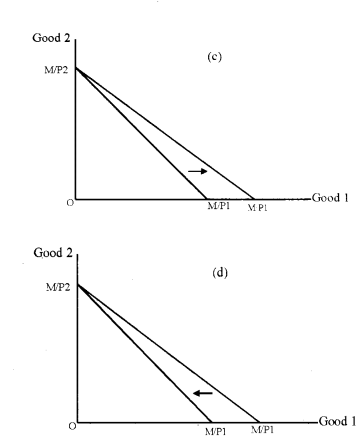
Question 6.
Suppose there are 2 consumers in the market for a good and their demand function are as follows Find out market demand function.
Answer:
First individuals demand function Second individual’s demand function = d2 (P) = 30 – 2p
∴ Market demand function = d1 (P) = d2 (P)
= 20 – p + 30 – 2p
= 50-3p
Question 7.
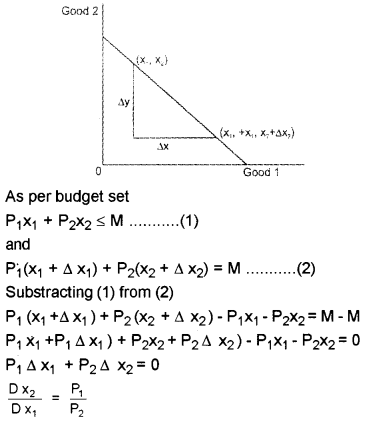
Derive the slope of budget line, using symbols?
Answer:
The slope of the budget line measures the amount of change in good 2 required per unit of change in good 1 along the budget line. Consider any two points (X1, x2) and (x1 + ΔX1,x2 + Δx2) on the budget line.
Question 8.
When price of orange is ₹4, consumer buys 50 units of it. The price elasticity is -2. How many units will the consumer buy at ₹3 per unit of orange?
Answer:
Σ d = -2
When P = 4, q = 50
When P = 3, q = ?

100 = 4 Δ q
Δ q = 100/4 =25
∴ New quantity = q + Δ q
= 50 + 25 = 75
Plus Two Economics Theory of Consumer Behaviour Five Mark Questions and Answers
Question 1.
The consumer has an income of Rs. 100. He wants to consume two goods X and Y. Prices of X and Y are Rs. 20 and 10 respectively.
- State the equation of the budget line.
- How much of good X he can buy if he spends entire income on good X.
- How much of good Y he can buy if he spends entire income on good Y.
Answer:
1. The equation of the budget line is given as P1 + P2X2=M
Where P1 and P2 are prices of good 1 and good 2 respectively. X1 and X2 are quantities of two goods. ‘M’ denotes the income of the consumer.
2. 5 units of good X.
3. 10 units of good Y
Question 2.
A consumer wants to consume two goods. The prices of the two goods are ₹4 and ₹5 respectively. The consumer’s income is ₹20.
- Write down the equation of the budget line
- How much of good 1 can the consumer consume if he spends his entire income on the good?
- How much of good 2 can the consumer consume if he spends his entire income on the good?
- What is the slope of the budget line?
Answer:
1. the equation of the budget line is p1x1+ p2x2= M
where P1 and P2 are prices of good1 and good 2. x-s and x2 are quantities of goods and M is his money income,
2. X1 = M/ P1
= 20/4 = 5 units
X2 = M/ P2
= 20/5 = 4 units
3. slope of the budget line is
= -P1/P2
= -4/5
= – 0.8 units
Question 3.
One important factor influencing demand is price of the product.
- Can you make a list of four other factors that influence the demand for a good?
- Also, establish the relationship between the factor identified and the demand for the product.
| Factor influencing Demand | Relationship between demand and the factor |
| Price of the product | Inversely related |
Answer:
- Column 1. Income, price of substitutes, advertisement, tastes & preferences
- Column 2. Positive, Negative, Positive, Positive
Question 4.
A few goods are given below. State whether the demand for the product is elastic or inelastic. Justify your answer.
Rice, salt, car, life-saving drugs, computer, electricity
Answer:
- Rice – Inelastic – Essential good Car – Elastic – Luxury good.
- Salt – Inelastic- Insignificant share in total expenditure. Life saving drugs – Inelastic – Not possible to postpone purchase.
- Computer- Elastic demand,Non-essential good. Electricity – Inelastic – No substitutes
Question 5.
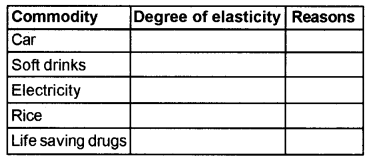
As you know elasticity of demand is influenced by several factors. Observing the nature of good given in the first column, complete the following table. Write whether the demand for the product is elastic or in¬elastic and also the reason.
Answer:
Column 2 – Column 3
Elastic – luxury product
Elastic – close substitutes are available
Elastic – no substitute
Elastic – Essential good
Elastic – Essential good
Question 6.
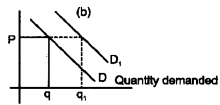
The diagram below shows the demand curves of commodities and b which are complementary to each other.
- What are complementary goods?
- Write two examples each for commodity
- The diagram shows the changes in the demand curve of commodity ‘b’ due to a fall in the price of commodity ‘a’.
Answer:
- Complementary goods are those goods demanded jointly for the consumption of one good, it requires other good too.
- Car, petrol, mobile phone, sim card, etc.
- When the price of ‘a1 comes down more of ‘a’ will be demanded. This would result in an increase in the demand for its complementary ‘b’.
Plus Two Economics Theory of Consumer Behaviour Eight Mark Questions and Answers
Question 1.
Prepare a seminar paper on the measurement of price elasticity of demand.
Answer:
Methods of measuring elasticity
Elasticity can be measured by using methods such as percentage method, linear method/point method, and expenditure method.
The detailed descriptions of the methods are as follows:
1. Percentage method:
Percentage method is also known as the proportionate method. As per percentage method estimate the elasticity of demand by dividing the percentage change in quantity demanded by the percentage change in price as given earlier. Thus, the formula for estimating elasticity of demand through percentage method is given as The procedure of computing elasticity using percentage method is provided in the example: 1.
2. Linear method/point method:
It is popularly known as the mathematical method of measuring price elasticity of demand. It is also known as point method of measuring elasticity of demand. The elasticity would be different on different points in a straight-line demand curve.
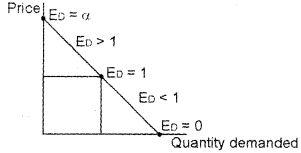
The following points can be observed from the above figure:
a. When a straight-line demand curve cut the X-axis, the elasticity of demand would be zero (eD = 0) (perfect inelastic demand).
b. The elasticity of demand at the midpoint on a straight-line demand curve would be one (eD = 1) (unitary elastic demand).
c. When a straight-line demand curve cut the Y-axis, the elasticity of demand would be zero (eD = a) (perfect elastic demand).
d. Between the midpoint and the point where the demand curve cuts the X-axis on a straight line would be less than one (inelastic demand) (eD = <1).
e. Between the midpoint and the point where the demand curve cuts the Y-axis on a straight line would be more than one (elastic demand) (eD>1).
3. Expenditure method:
The total expenditure on a commodity can be find out by multiplying the quantity of commodity with its price. As per expenditure method, the price elasticity is measured by comparing the change in price and the change in total expenditure. Three possibilities may occur in this context.
a. If the total expenditure does not change even if there is a price change, then elasticity would be 1 or unity (eD = 1)
b. If the total expenditure decreases as a result of increase in price or total expenditure increases as a result of fall in price, it would be more elastic (eD> 1).
c. If the total expenditure increases as a result of decrease in price or total expenditure decreases as a result of rise in price, it would be less elastic (eD = <1).
Question 2.
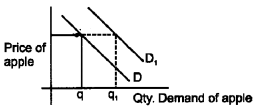
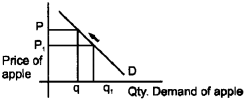
The demand curve for apple is given below. Show the effect on the demand curve for apple due to the following factors.
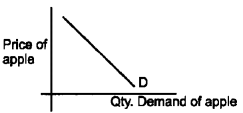
- A newspaper report stating the health benefit of apple
- The price of apple increases.
- What is price elasticity of demand? What do you think about the price elasticity of apple. Justify your answer.
Answer:
1. The demand curve for apple shifts rightward. Taste and preference arise in favour of apple.
2. There is a movement along the demand curve. This is due to an increase in price. Quantity demand of apple falls.
3. It is the responsiveness of quantity demanded to a change in price.
\(\mathrm{Ped}=\frac{\% \mathrm{Δad}}{\% \mathrm{ΔP}}\)
