Kerala Plus One Maths Chapter Wise Previous Questions Chapter 15 Statistics
Plus One Maths Statistics 3 Marks Important Questions
Question 1.
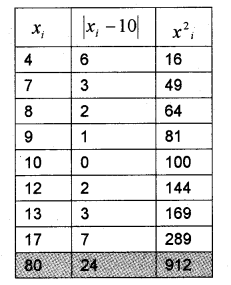
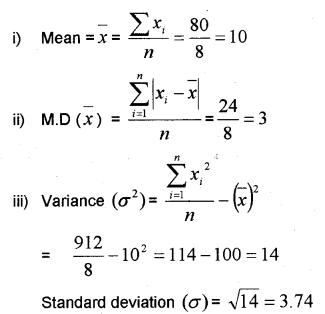
Consider the numbers 4,7,8,9,10,12,13,17 (MARCH-2010)
i) Find the mean of the numbers.
ii) Find the mean deviation about the mean.
iii) Find the standard deviation.
Answer:
Question 2.
Consider the following data; 35,49,30,32,50,41,34,45,36 (MARCH-2013)
i) Find its median.
ii) Find its mean deviation about median
Answer:
i) 30, 32, 34, 35, 36, 41, 45, 49, 50
Median is the 5th observation when the data is arranged in ascending order. Hence median = 36
ii)

Question 3.
The mean and standard deviation of marks obtained by 50 students of 50 students in a class in two subjects mathematics are given below: (IMP-2014)

Which one of the subject shows highest variability in marks? Why?
Answer:
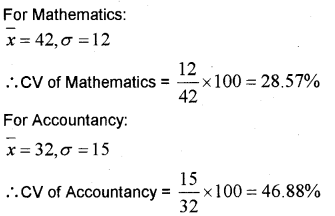
Thus Accountancy with highest CV shows highest variability and Mathematics with lowest CV shows lowest variability.
Plus One Maths Statistics 4 Marks Important Questions
Question 1.
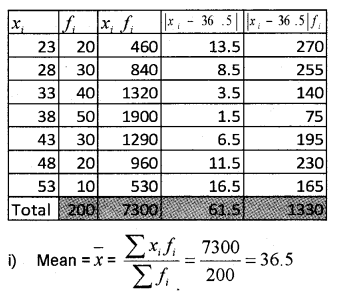
A public Opinion polling agency surveyed 200 government employees. The following table shows the ages of the employees interviewed: (MARCH-2011)

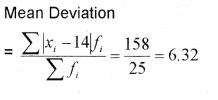
i) Calculate the mean age of the employees interview.
ii) Compute the mean deviation of the ages about the mean age.
Answer:

Question 2.
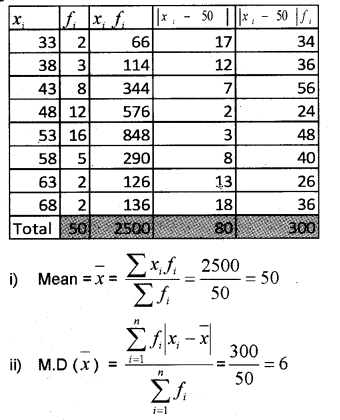
Consider the following frequency table. (IMP-2011)

i) Find the mean.
ii) Find the mean deviation about mean.
Answer:
Question 3.
Consider the following data in respect of marks of 50 students in Mathematics and Physics. (IMP-2011)

i) Find coefficient of variation of Mathematics and Physics.
ii) Which subject shows more variability?
iii) Which subject shows more consistent?
Answer:
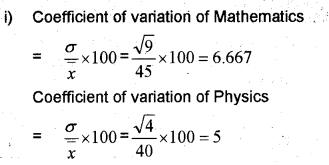
ii) Greater CV more variability; therefore Mathematics is more variable than Physics.
iii) Less CV more consistent, therefore Physics is more consistent.
Question 4.
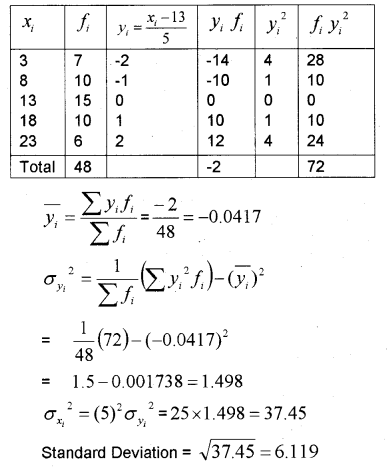
Find the Standard deviation for the following data: (IMP-2012)

Answer:
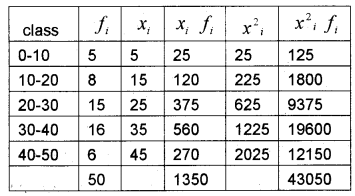
Question 5.
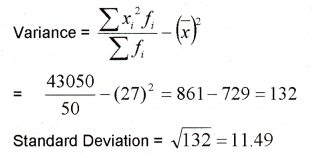
Consider the frequency distribution. (MARCH-2013)

i) Find the mean.
ii) Calculate the variance and the standard deviation.
Answer:
i)

ii)
Question 6.
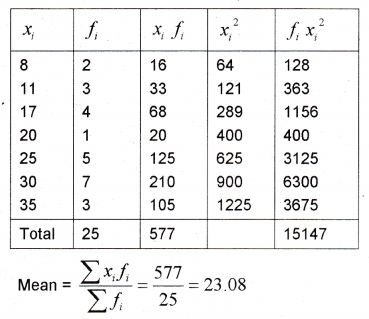
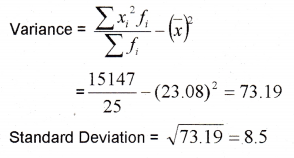
Consider the frequency distribution. (MARCH-2013)

i) Find the mean.
ii) Calculate the variance and standard deviation.
Answer:
i)
ii)
Question 7.
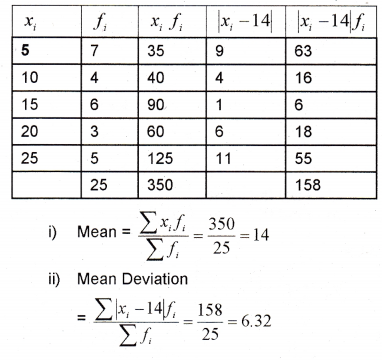
Consider the following frequency table (MARCH-2014)

i) Find the mean.
ii) Find the mean deviation about the mean.
Answer:
Question 8.
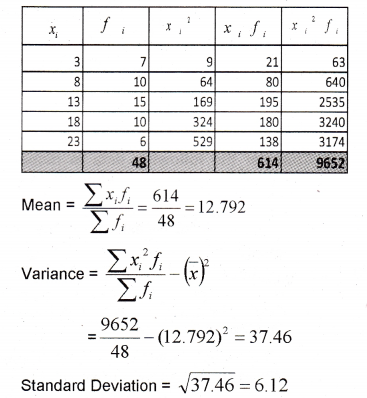
Find the standard deviation of the data: (IMP-2014)

Answer:
Plus One Maths Statistics 6 Marks Important Questions
Question 1.
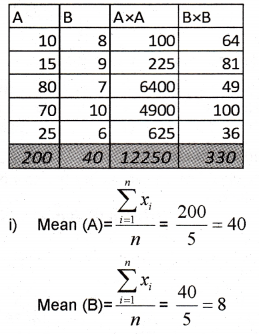
The scores of two batsmen A and B in 5 innings during a certain match are as follows: (IMP-2010)

Find:
i) Mean score of each batsman.
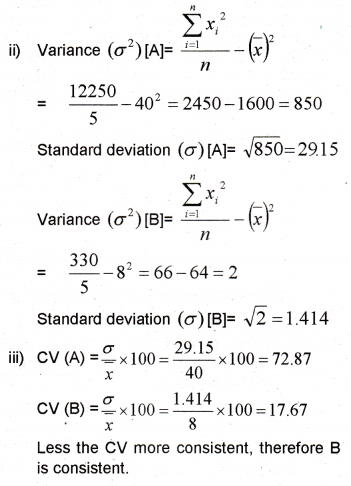
ii) Standard deviation of the scores of each batsman.
iii) Which of the batsman is more consistent?
Answer:
Question 2.
Calculate mean, variance and standard deviation for the following distribution. (IMP-2012)

Answer:
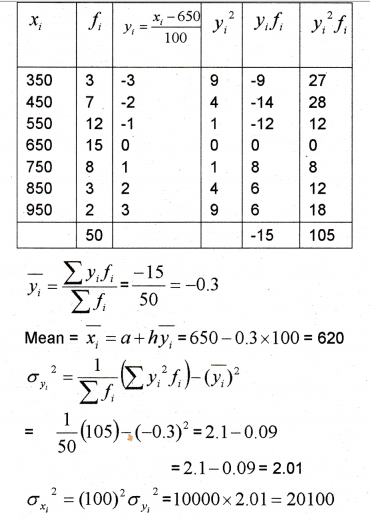
Standard Deviation = √20100 = 141.8
Question 3.
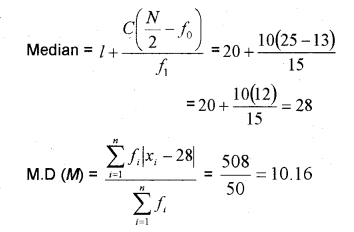
Calculate the median and Mean deviation about median for the following data. (IMP-2012)

Answer:
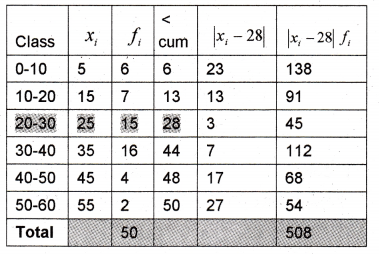
Median class is the class in which the (502=25)th observation lies. Therefore median class is 20 – 30.
Question 4.
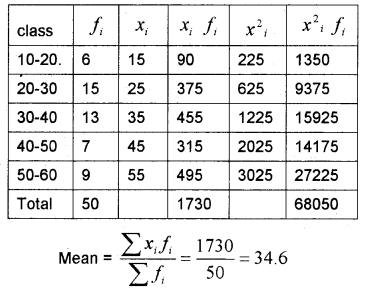
Consider the following distribution; (MARCH-2012)

i) Calculate the mean of the distribution.
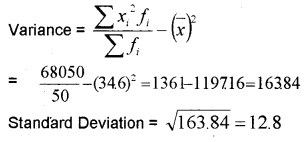
ii) Calculate the standard deviation of the distribution.
Answer:
i)
ii)
Question 5.
Consider the following distribution. (IMP-2012)

i) Find the mean.
ii) Find the standard deviation.
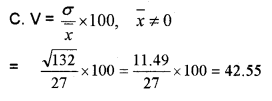
iii) Find the coefficient of variation of marks.
Answer:
i)

ii)


iii)
Question 6.
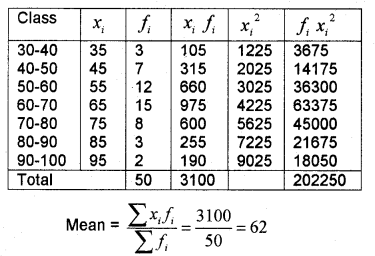
Consider the frequency distribution (MARCH-2014)

i) Find the mean.
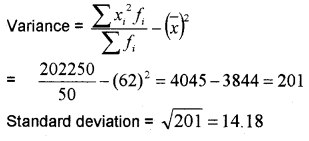
ii) Calculate the variance and the standard deviation.
Answer:
i)
ii)
Question 7.
i) If overlinex is the mean and a is the standard deviation of a distribution, then the coefficient of variation is ……… (MARCH-2015)
a) ˉxσ×100
b) σˉx
c) σˉx×100
d) ˉxσ×50
ii) Find the standard deviation for the following data:

Answer:
i)
ˉxσ×100
ii)

Question 8.
i) The sum of all the deviations of the observations of a data from its A.M. is …………. (IMP-2013)
a) Zero
b) Maximum
c) Minimum
d) Negative number
ii) Calculate the Mean. Variance and Standard deviations of the following frequency distribution.

Answer:
i) a) zero
ii)


Question 9.
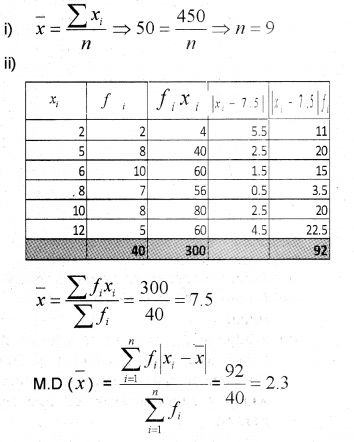
i) Suppose the mean of certain number of observation is 50 and the sum of all the observations is 450. Write down the number of observations (MARCH-2016)
ii) Find the mean deviation about mean for the following data:

Answer:
Question 10.
i) If the variance of a certain distribution is 8, write its standard deviation. (MAY-2017)
ii) Find the mean, standard deviation and coefficient of variation for the following frequency distribution.

Answer:
i) √8
ii)


Question 11.
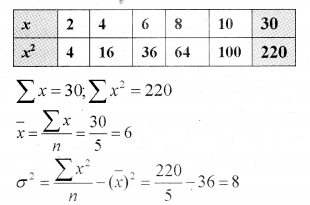
i) Find the variance for the observations 2,4,6,8 and 10. (MARCH-2017)
ii) Consider the frequency distribution

Answer:
i)
ii)
