Kerala Plus One Economics Previous Year Question Paper March 2018 with Answers
| Board | SCERT |
| Class | Plus One |
| Subject | Economics |
| Category | Plus One Previous Year Question Papers |
Time Allowed: 21/2 hours
Cool off time: 15 Minutes
Maximum Marks: 80
General Instructions to Candidates :
- There is a ‘cool off time’ of 15 minutes in addition to the writing time of 21/2 hrs.
- You are not allowed to write your answers nor to discuss anything with others during the ‘cool off time’.
- Use the ‘cool off time’ to get familiar with the questions and to plan your answers.
- Read questions carefully before you answering.
- All questions are compulsory and only internal choice is allowed.
- When you select a question, all the sub-questions must be answered from the same question itself.
- Calculations, figures and graphs should be shown in the answer sheet itself.
- Malayalam version of the questions is also provided.
- Give equations wherever necessary.
- Electronic devices except non-programmable calculators are not allowed in the Examination Hall.
Answer all questions from 1 to 5. Each carry one score. (5 × 1 = 5)
Question 1.
The following are the components of secondary sector except
a) manufacturing
b) construction
c) trade
d) electricity, gas and water supply
Answer:
c) trade
Question 2.
The advantages of a particular mode of a data collection is given below. Identify the mode of data collection.
- Highest response rate
- Better for using open ended questions
- Allows clarification of ambiguous questions
- Allows the use of all type of questions
a) personal interview
b) Telephonic interview
c) Mail the questionnaire
d) None of these
Answer:
a) personal interview
Question 3.
The following factors are responsible for land degradation except ………….
a) shifting cultivation
b) improper crop rotation
c) afforestation
d) indiscriminate use of agrochemicals
Answer:
c) afforestation
Question 4.
The midpoint of ‘10 – 15’ is ………….
a) 7.5
b) 10
c) 12.5
d) 2.5
Answer:
c) 12.5
Question 5.
Golden Revolution relates to …………
a) Horticulture
b) Sericulture
c) Pisciculture
d) None of these
Answer:
a) Horticulture
Question 6.
Match the columns B and C with column A. (5 × 1 = 5)
| A | B | C | |
| a) | Green Revolution | BRICS | Base Year |
| b) | Index Number | Mail the Questionnaire | Quartile Deviation |
| c) | SAARC | HYV Seeds | Telephonic Interview |
| d) | Personal Interview | Mean Deviation | Use of Fertilizers |
| e) | Lorenz Curve | Current Year | ASEAN |
Answer:
| A | B | C | |
| a) | Green Revolution | HYV Seeds | Use of Fertilizers |
| b) | Index Number | Current Year | Base Year |
| c) | SAARC | BRICS | ASEAN |
| d) | Personal Interview | Mail the Questionnaire | Telephonic Interview |
| e) | Lorenz Curve | Mean Deviation | Quartile Deviation |
Answer all questions from 7 to 11. Each carries two scores. (5 × 2 = 10)
Question 7.
Categorize the following programmes under the heads of wage employment and self-employment programmes.
a) REGP
b) NFWP
c) PMRY
d) MGNREGS
Answer:
Wage Employment:
- MGNREGS
- NFWP
Self Employment:
- PMRY
- REGP
Question 8.
Workers can be classified in many ways. One type of classification is casual wage worker and regular salaried worker. Cite two examples of them.
Answer:
Casual Wage Workers:
- Workers in agriculture sector
- Construction workers
Regular Salaried Workers:
- Bank staff
- Policemen
Question 9.
Human capital and human development are interrelated. Point out any two relationships between them.
Answer:
- Human capital and human dvelopment are integral to human well-being.
- Both forms of capital enhance output of goods and services of an economy.
Question 10.
Classes can be arranged in inclusive and exclusive manner. Point out any two features which help us to distinguish them.
Answer:
| Exclusive Class | Inclusive Class |
| 1. It’s upper limit of a class is the lower limit of the next higher class | 1. It does not exclude the upper class limit in a class interval |
| 2. It maintains the continuity of the data | 2. It is a discrete frequency distribution |
Question 11.
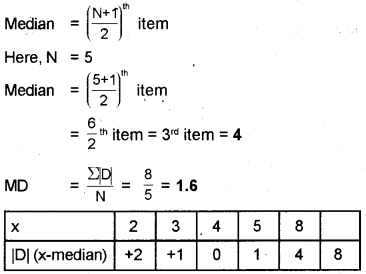
Calculate the mean deviation from the median for the following observations.
values: 3, 5, 8, 2, 4
Answer:
x = 3, 5, 8, 2, 4
Arranging the values in ascending order, we get x = 2, 3, 4, 5, 8
Answer any six questions from 12 to 18. Each carries three scores. (6 × 3 = 18)
Question 12.
Statistics helps the economics in various ways. Cite three instances for it.
Answer:
Statistics helps the economists in various ways. They are:
- It helps him to understand an economic problem.
- It is used in finding relationships between different economic variables.
- It contributes in the formulation plans and policies of the government.
Question 13.
In the field of infrastructure, the British government took many initiatives during the colonial period. Do you consider that, these are the positive contributions of the British? Substantiate.
Answer:
I do not agree. The infrastructure facilities in India began to develop during the colonial period. However, the real motive behind this development was not to provide basic amenities to the people but to protect various colonial interests.
Question 14.
The Industrial Policy Resolution of 1956 formed the basis of Second Five Year Plan. It was a milestone in the history of Indian industrial development. Point out the important features of the policy.
Answer:
The Industrial Policy Resolution (1956) had some features which are given below:
- The basic and key industries were to be under the control of the state.
- Industries are classified into three categories such as industries exclusively owned by the state, industries owned by both state and private sector and industries to be under the private sector.
- The licensing policy was used to promote balanced regional growth.
Question 15.
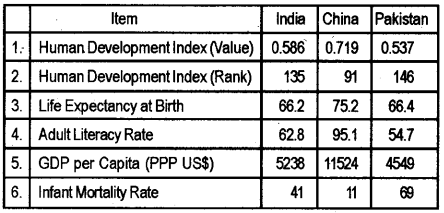
India, China and Pakistan had started their development strategies almost at the same time. Observe the following table and draw three inferences regarding the state of human development of these countries.
Some selected indicators of Human Development 2012 – 13
Answer:
- As compared to India and Pakistan, China is ahead in the Human Development Index Rank.
- China stands in front of India and Pakistan in life expectancy.
- Maternal mortality rates are high in both India and Pakistan.
Question 16.
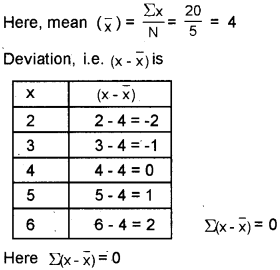
Arithmetic Mean has an interesting property. Identify and prove it with an example.
Answer:
An interesting property of arithmetic mean is that the sum of the deviations of items about arithmetic mean is always equal to zero i.e.,
For example x = 2, 3, 4, 5, 6
Question 17.
Statistics and Economics are closely related. Some statistical tools and their uses are given below. Match them correctly.
| Tools | Uses | |
| a) | Median, Correlation, Standard Deviation | Organisation and presentation of Data |
| b) | Tables, Pie Diagrams, Arithmetic Line Graph | Bibliography |
| c) | Magazines, Research Reports, Newspaper | Analysis and interpretation of Data |
Answer:
| Tools | Uses |
| Median, correlation Standard deviation | Analysis and interpretation of data |
| Tables, Pie diagrams, Arithmetic line graph | Organization and presentation of data |
| Magazines, Research Reports, Newspaper | Bibliography |
Question 18.
Environment and sustainable development are interconnected. List out any six functions of environment.
Answer:
Environment and sustainable development are interdependence. Some functions of environment are given below,
- It supplies resources
- It assimilates waste
- It sustains life
- It provides aesthetic services
- It provides goods and services to people
- It promotes the development of a nation
Answer any four questions from 19 to 23. Each carries four scores. (4 × 4 = 16)
Question 19.
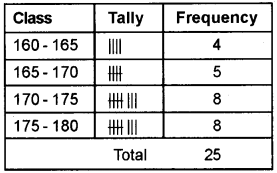
Details given below shows the height of 25 participants in a selection test. The minimum required height for the post is 170 cms. Prepare a frequency distribution table by exclusive method by taking class interval of 5. Find out the number of participants selected.
160, 164, 170, 179, 165, 168, 162, 165, 173, 177, 175, 164, 172, 178, 166, 174, 168, 179, 176, 172, 178, 173, 171, 172, 178.
Answer:
Question 20.
Calculate the price index number.
| Price of the commodities in 2016-2017 | 9 | 12 | 10 | 14 |
| Price of the commodities in 2011 – 2012 | 6 | 8 | 7 | 10 |
Answer:
Price Index Number =
| Price of the commodities in 2016 – 2017 (P1) | Price of the commodities in 2011 – 2012(P0) |
| 9 | 6 |
| 12 | 8 |
| 10 | 7 |
| 14 | 10 |
| ΣP1 = 45 | ΣP0 = 31 |
Price Index Number = × 100 = 145.16
Question 21.
“If the misery of the poor be caused not by the laws of nature, but by our institutions, great is our sin” – Charles Darwin.
In the light of this quotation, list out and analyse the causes of poverty in India.
Answer:
There are different causes of poverty in India.
Most important among them are:
- Rapid growth of population
- Overdependence on agriculture sector
- Stagnation in industrial sector
- Lack of education and technical skills
- Backwardness in healthcare sector
- Less growth in infrastructure sector
- Inequalities in the distribution of wealth and income
- Indebtedness of people in India
- Inefficiencies in the implimentation of poverty eradication programmes.
Question 22.
The development of health infrastructure ensure a country of healthy manpower. Whether the present status of Indian infrastructure is sufficient to keep the people healthy? Analyze.
Answer:
The development of health infrastructure is the constitutional obligation of the government. India has built up a wide health infrastructure and manpower at different levels. As compared to other countries, India’s share to health sector is very low. Our country bears 20% of the global burden of diseases (GBD). At present, less than 20% of the population utilities public health facilities. Every year 2.2 million children die of malnutrition and inadequate supply of vaccines.
Question 23.
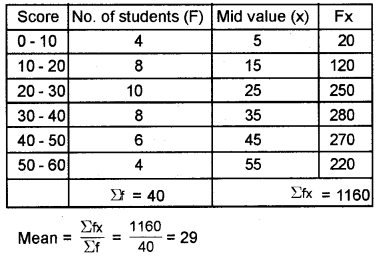
Scores of 40 students in an examination is given below. Calculate the mean.
| Score | No. of students |
| 0 – 10 | 4 |
| 10 – 20 | 8 |
| 20 – 30 | 10 |
| 30 – 40 | 8 |
| 40 – 50 | 6 |
| 50 – 60 | 4 |
Answer:
Answer any two questions from 24 to 26. Each carries five scores. (2 × 5 = 10)
Question 24.
The concept of human capital is relatively more important in labour surplus economies like India. To make human capital formation possible the government has to address some areas. Identify these areas. Analyse the relationship between human capital formation and economic growth.
Answer:
Human capital plays an important role in the development of a country. There are five sectors of human capital formation in India. They are:
- Education
- Health
- On the job training
- Migration
- Information
Relationship between human capital and economic growth:
India recognised significance of human capital in economic growth long ago. Economic growth means the increase in real national income of a country. Five sources of human capital is increasing individuals’ income earning capacity. This enhanced productivity of human beings stimulates innovation and ability to absorb new technologies.
The real per capita income is increasing after independence. This indicates that economic growth. Just as decrease in death rate and infant mortality rate along with the growth in economic sector. At the same time life expectancy has also increased. It is interesting to notice that the quality of human capital improves as a result of economic growth that our country had attained.
Question 25.
Now-a-days people discuss more about organic farming. Why? Discuss the following:
a) Advantages of organic farming.
b) Organic farming and sustainable development.
Answer:
In recent years there were much discussions on organic farming because it restores, maintains and enhances the ecological balance.
a) Advantages of organic farming
- It generates good returns on investment
- It creates more income through experts due to high demand.
- Organically grown food has more nutritional value
- It requires more labour inputs
- Organic products are environment friendly
b) Organic farming and sustainable development are interrelated for the development of a nation. Efforts for developing an eco-friendly technology are essential for sustainable development. One such method is organic farming. It is a whole system of farming. The demand for organically grown food is increasing throughout the world as it enhances food safety.
Question 26.
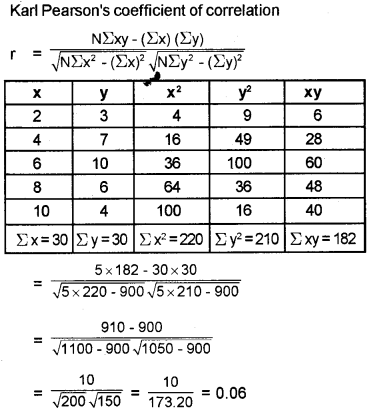
Calculate Karl Pearson’s coefficient of correlation.
| X | 2 | 4 | 6 | 8 | 10 |
| y | 3 | 7 | 10 | 6 | 4 |
Answer:
Answer any two questions from 27 to 29. Each carries eight scores. (2 × 8 = 16)
Question 27.
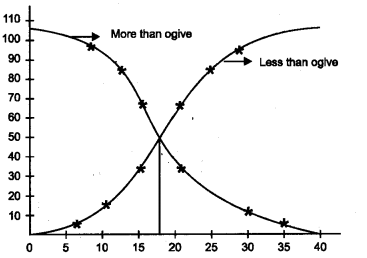
Antoine Augustin Cournot in 1843, was the first who used the term Median for the value that divides a probability distribution into two equal halves. Median can be located graphically with the help of Ogives. Draw Ogives and locate the median by using the following table.
Scores | No. of students |
| 0 – 5 | 5 |
| 5 – 10 | 10 |
| 10 – 15 | 20 |
| 15 – 20 | 30 |
| 20 – 25 | 20 |
| 25 – 30 | 9 |
| 30 – 35 | 5 |
| 35 – 40 | 3 |
Answer:
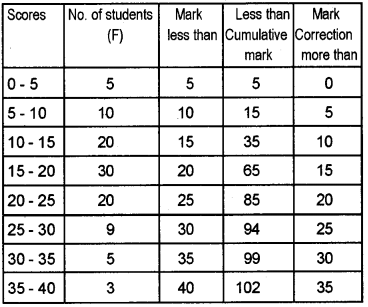
More than cumulative frequency
102, 97, 87, 67, 37, 17, 8, 3
Mean = 17.67
Question 28.
We learnt that India implemented new Economic Policy in 1991. It affected all sectors of our economy. On this basis,
a) List out and analyse the reform measures adopted in agriculture, Industry and financial sectors.
b) Critically evaluate the impact of these economic reforms in the measures of agriculture, industrial and financial sectors.
Answer:
implemented new economic reforms in 1991. It adopted in agriculture, industry and financial sectors which are given below:
Reforms in agriculture:
The reform led growth has not benefitted the agriculture sector, contrary to the experience of the economy as a whole. There was a declaration in the growth rate of agriculture sector. The major reasons for the poor performance of agriculture are,
- Fall in public investment in agriculture
- Withdrawl of fertilizer subsidy
- The reduction of import duty
- The removal of minimum support price
- The export policy badly affected on food crops
Reforms in Industry:
Industrial sector has grown at a respectable rate but are marked by considerable fluctuations. The fluctuating performance was mainly due to slow down in investment, infrastructural constraints, slow growth of exports, etc. There is no doubt that the reforms have been successful in improving the competitiveness of the private sector. Government has promoted progressive privatisation through disinvestment.
Reforms in fiscal policies:
Reforms aimed at curtailing wasteful expenditures of the government. The tax reforms aimed at increasing tax revenue and checking tax evasion by lowering the tax rates and widening of tax base. It also aimed at reducing the income disparities. But the reforms failed to generate the desired results.
- It led to widening of gap between the rich and the poor.
- It has also magnified regional disparities within the country.
- The performance of agriculture in the post reform period has not been very impressive, causing a looming agrarian crisis.
- The performance of industrial sector has not been satisfactory.
- It has intensified the problem of unemployment and poverty.
Question 29.
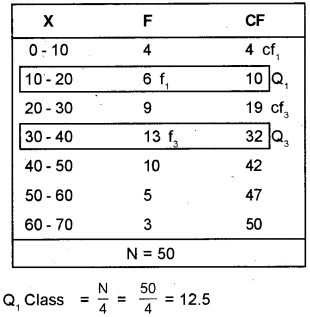
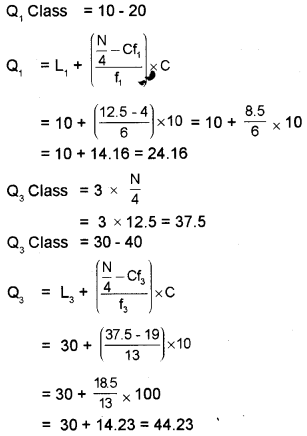
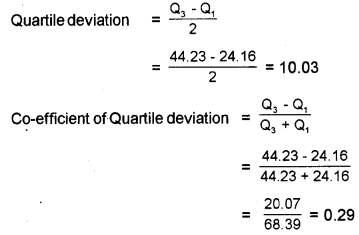
Calculate the quartile deviation and coefficient of quartile deviation for the following distribution.
| X | F |
| 0 – 10 | 4 |
| 10 – 20 | 6 |
| 20 – 30 | 9 |
| 30 – 40 | 13 |
| 40 – 50 | 10 |
| 50 – 60 | 5 |
| 60 – 70 | 3 |
Answer:
