Kerala Plus One Economics Model Question Paper 1 with Answers
| Board | SCERT |
| Class | Plus One |
| Subject | Economics |
| Category | Plus One Previous Year Question Papers |
Time Allowed: 21/2 hours
Cool off time: 15 Minutes
Maximum Marks: 80
General Instructions to Candidates :
- There is a ‘cool off time’ of 15 minutes in addition to the writing time of 21/2 hrs.
- You are not allowed to write your answers nor to discuss anything with others during the ‘cool off time’.
- Use the ‘cool off time’ to get familiar with the questions and to plan your answers.
- Read questions carefully before you answering.
- All questions are compulsory and only internal choice is allowed.
- When you select a question, all the sub-questions must be answered from the same question itself.
- Calculations, figures and graphs should be shown in the answer sheet itself.
- Malayalam version of the questions is also provided.
- Give equations wherever necessary.
- Electronic devices except non-programmable calculators are not allowed in the Examination Hall.
Question 1 carries 5 Score Match the column A with B and C. (5 × 1 = 5)
Question 1.
| A | B | C | |
| a) | China | Coal | Median |
| b) | Conventional sources of energy | Commune system | Dispersion |
| c) | Industrial Policy-Resolution 1956 | Cumulative frequency curve | Petroleum |
| d) | Ogive | One child norm | |
| e) | Co-efficient of range | Three categories of industry | Importance to public sector |
Answer:
| A | B | C |
| China | Commune system | One child norm |
| Conventional sources of energy | Coal | Petroleum |
| Industrial Policy Resolution 1956 | Three categories of industry | Importance to public sector |
| Ogive | Cumulative frequency curve | Median |
| Co-efficient of range | Dispersion |
Questions 2 to 6: Answer all the questions. Each carries 1 Score. (5 × 1 = 5)
Question 2.
Government taxation and public expenditure policies which are collectively known as ………….
a) Monetary policy
b) Fiscal policy
c) Trade policy
d) None of the above
Answer:
b) Fiscal policy
Question 3.
A survey which includes every element of the population is known as …………
a) Random sampling method
b) Non-sampling method
c) Census method
d) None of the above
Answer:
c) Census method
Question 4.
In India inflation is calculated by using …………
a) Whole sale price index
b) Consumer price index
c) Producer price index
d) None of the above
Answer:
c) Producer price index
Question 5.
The value of correlation coefficient lies between
a) minus one and zero
b) minus one and plus one
c) minus one and plus two
d) none of the above
Answer:
b) minus one and plus one
Question 6.
Britain intensified control over India’s foreign trade with the opening of ……….
a) Panama canal
b) Suez canal
c) Grand canal
d) Kiel canal
Answer:
b) Suez canal
Questions 7 – 11: Answer all the questions. Each question carries two Scores. (5 × 2 = 10)
Question 7.
During the British period in India, social development indicators were not satisfactory. Substantiate the statement with the help of any two indicators.
Answer:
During the British period in India, social development indicators were not satisfactory.
- Agriculture stagnated farmer’s income remained low due to poor productivity.
- India became a market for British goods.
Question 8.
List out the importance of statistics in economics.
Answer:
Importance of statistics in economics are given below.
- It helps to understand the economic problems of a country.
- Complex numeral date in economics are simplified through statistical methods.
Question 9.
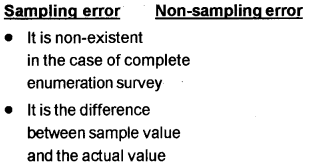
There are two types of error in sampling. One is sampling error and the other one is Non-Sampling error. List out the differences.
Answer:
Question 10.
Classify the following variables under qualitative and quantitative.
Income, literacy, height, intelligence.
Answer:
Qualitative variable:
- intelligence
- literacy
Quantitative variable:
- income
- height
Question 11.
In some states, farmers directly sell their products to consumers. Give two examples of such markets.
Answer:
Apni Mandi (Punjab, Hariyana, Rajasthan), Hadapsar Mandi (Pune)
Questions 12 – 18: Attempt any six. Each carries 3 Scores. (6 × 3 = 18)
Question 12.
Telephonic interview is one among the modes of data collection. Give three merits.
Answer:
There are some merits of Telephone interview which are they.
- It is less expensive.
- It can be conducted in a shorter time.
- It facilitates classification of doubts of respondents.
Question 13.
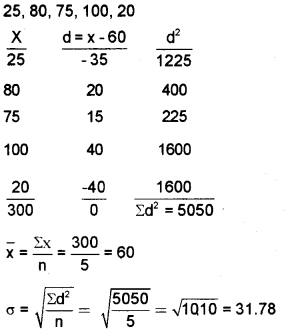
Calculate the mean deviation from mean of the following data.
25, 80, 75, 100, 20
Answer:
Question 14.
Whether the import subscription policy, which we followed till 1991, was effective to protect our domestic industries. Identify the policy instruments and substantiate.
Answer:
Import subscription policy was effective to protect our domestic industries protection can be possible through
- Tariff
- Quotas
Imposition of import duties raises the prices of foreign goods.
Quotas are quantitative restriction on imports.
Question 15.
Identify the similarities in respect of the development strategies adopted by India, China and Pakistan.
Answer:
Similarities of development strategies among India, China and Pakistan are given below.
| India | China | Pakistan |
| Independent in 1947 | Independent in 1949 | Independent in 1947 |
| Planning strategy started 1951 | Planning strategy started 1953 | Planning strategy started 1956 |
| Similar growth rate | Similar growth rate | Similar growth rate |
| Govt played major role in economy | Govt played major role in economy | Govt played major role |
Question 16.
Sustainable development are indispensable for any Nation. Point out 3 examples in your locality which acts as obstacles for Sustainable development.
Answer:
There are many hindrances for sustainable development in our area which are they
- Increasing population in the area.
- Rapid growth of industrialisation.
- Land degradation.
Question 17.
Calculate the weighted aggregative price index of the following data.
(Here weightage is given to base period quantities)
| Commodity | Base Period | Current period | ||
| Price (P0) | Quantity (P1) | Price (P1) | Quantity (Q1) | |
| A | 10 | 10 | 15 | 12 |
| B | 15 | 20 | 20 | 18 |
| C | 20 | 30 | 25 | 33 |
| D | 25 | 40 | 30 | 45 |
Answer:
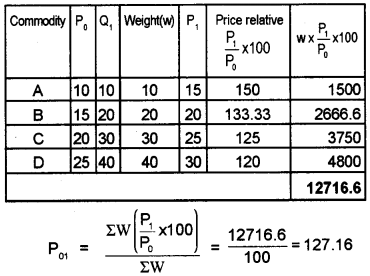
Question 18.
Orderly arrange the steps towards making a project. Conclusion, choice of target group, organisation and presentation of data, analysis and interpretation, identifying a problem or an area of study collection of data.
Answer:
Steps of a project are given below
- Identify a problem or an area of study
- Choice of target group
- Collection of data
- Organisation and presentation of data
- Analysis and interpretation
- Conclusion
Questions 19 – 23: Attempt any four. Each carries 4 Score. (4 × 4 = 16)
Question 19.
The Government of India decided to deregulate the industrial sector as a part of liberalisation policy in 1991. List out the measures adopted for this purpose.
Answer:
Deregulation of industrial sector are
- Delicensing: Only few industries need licensing others have been delicensed.
- Dereservation: The number of industries reserved for the public sector has been drastically reduced.
- Dereservation of goods for small-scale sector: Number of goods reserved for the small scale sector was reduced.
- Amendment of MRTP and FERA: MRTP Act and FERA were amended to facilitate private investment.
Question 20.
‘Investment in education can stimulate the economic growth’. Do you agree with this statement? Substantiate.
Answer:
I agree with this statement.
Investment in education can stimulate the economic growth which are given below
- Education raises the quality and life
- It increases earning capacity through higher productivity.
- Stimulates discoveries and innovations
- Contributes to nation’s growth and development.
Question 21.
The marks of 50 students in Economics class test are given below.
9, 18, 78, 90, 63, 26, 39, 44, 6, 84, 63, 44, 56, 8, 67, 53, 83, 45, 18, 92, 95, 28, 65, 12, 24, 77, 7, 25, 25, 36, 55, 33, 75, 91, 61, 19, 58, 85, 44, 55, 86, 37, 51, 34, 33, 87, 60, 48, 78, 63
Prepare a frequency distribution table with tally mark by exclusive method taking class interval often.
Answer:
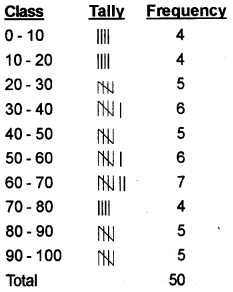
Question 22.
The rank of 10 students in English and Economics examinations are given below. Calculate the rank correlation coefficient.
| Students | Rank in Economics | Rank in English |
| A | 1 | 4 |
| B | 2 | 3 |
| C | 3 | 2 |
| D | 4 | 1 |
| E | 5 | 6 |
| F | 6 | 10 |
| G | 7 | 5 |
| H | 8 | 7 |
| I | 9 | 8 |
| J | 10 | 9 |
Answer:
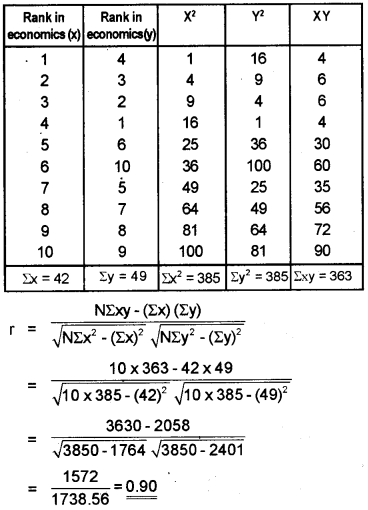
Question 23.
Indebtedness are still common in rural areas due to the exploitation of moneylenders. To avoid this problem and to ensure the credit facilities in rural areas, the government started many institutions. Briefly explain.
Answer:
The government impliment many institutions in rural areas to avoid the problem of credit facilities. Which are they.
- NABARD
- Commercial banks
- Regional Rural Banks (RRBs)
- Co-operative credit institutions
- Land development banks, and
- Self Help Group (Microcredit)
The Government should come forward with better plans and programmes for rural development. Investment in education, improvement of rural infrastructure and non-form employment should be given top priority.
Questions 24 – 26: Attempt any two. Each carries 5 Score. (2 × 5 = 10)
Question 24.
Distribution of employment by region.
Urban Workers
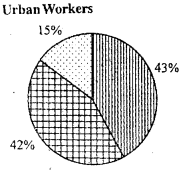
Rural Workers
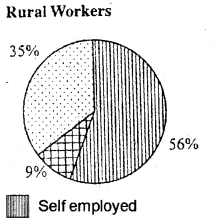

Compare the two diagrams and make five inferences.
Answer:
- Self employed and salaried workers are major among urban workers.
- Casual labourer are very less in urban areas.
- More than half of rural workers are self-employed workers.
- Salaried employees are very less in rural areas.
- In both rural and urban areas, self employed workers form significant number.
Question 25.
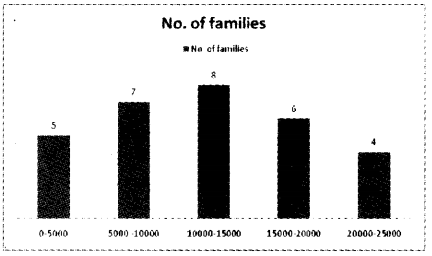
The following are the distribution of monthly income of 30 workers in a particular village. Draw a histogram and locate the mode.
| Income | Number of families |
| 0 – 5,000 | 5 |
| 5,000 – 10,000 | 7 |
| 10,000 – 15,000 | 8 |
| 15,000 – 20,000 | 6 |
| 20,000 – 30,000 | 4 |
Answer:
Question 26.
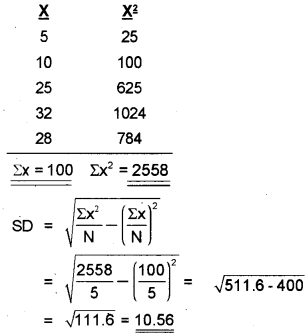
Calculate the standard deviation of the following values.
5, 10, 25, 32, 28
Answer:
Questions 27 – 29: Attempt any two. Each carries 8 Score. (2 × 8 = 16)
Question 27.
‘Poverty is a situation in which a person is unable to secure the basic minimum necessities of life’.
You think that the eradication of poverty is a social necessity. Why?
Evaluate the three-dimensional approach adopted by the Govt, of India to alleviate the poverty in our country. [Hints: poverty – causes – policies and programmes for poverty alleviation]
Answer:
Poverty is a situation in which some people do not have enough income to fulfil the basic necessities of life.
Causes of poverty:
The main causes of poverty in India are the following
- Low income
- Lack of assets
- Unemployment
- Inequalities
- Isolation and powerlessness
- Unsatisfactory economic growth
- Population explosion
- Backward agriculture and low level of industrialization.
- Inflation
Policies and Programmes for Poverty Alleviation:
India tackle poverty through economic growth. Economic growth generates jobs and income for the people. These benefits of growth trickle down to the poor people. This is known as ‘trickle down theory’. The government decided to implement the pull up theory.
The government of India adopted a three approach to poverty reduction
- Growth-oriented approach
- Generation of employment and income through creation of assets and works.
- Provision of minimum basic amenities to the people.
Policies and programmes for poverty alleviation are classified into three categories They are.
I. Self-employment and wage employment programmes:
Some of the important programmes are given below.
- Swamajayanti Gram Swarogaryojana (SGSY).
- Prime Minister Rozgar Yojana (PMRY).
- Rural Employment Generation programme (REGP).
- Swarna Jayanthi Shahari Rozgar Yojana (SJSRY).
- Nehru RozgarYojana (NRY).
- National Rural Employment Guarantee Programme. (NREGP).
II. Food Security Programmes:
- Public Distribution System (PDS)
- Integrated Child Development Scheme (ICDS)
- Mid-day Meals at Schools (MDMS)
- Annapurna Scheme (AS)
III. Social Security Programmes
- Am Admi Bhima Yojana
- Rashtriya Swasthika Bhima Yojana
- Janasree Bhima Yojana
- Pradhan Mantri Jeevan Jyothi Bhima Yojana v Pradhan Mantri Suraksha Bhima Yojana
Continuation of high growth rate is important because only growth can generate the required resources for the implementation of anti-poverty programmes.
Question 28.
Sustainable development mainly focussed on Ecofriendly development. The use of conventional sources of energy and sustainable development are moving in opposite directions. How the use of Non-conventional sources of energy can promote sustainable development? Analyse.
(Hints: Sustainable development, Strategies, conventional sources of energy and its uses. Non-conventional sources of energy)
Answer:
Sustainable development is defined as “development that meets the end of the present generation without compromising the ability of the future generation to meet their own needs”.
Strategies for sustainable development. It should pay attention to avoid environmental degradation by limiting the use of natural resources. Strategies for it are given below.
- Use of conventional sources of energy.
- Wind power.
- Solar power through photo voltaic cells.
- Use of LPG, Gobar gas in rural areas.
- Use of CNG in urban areas.
- Mini-hydel plants.
- Traditional knowledge and practices
- Bio composting
- Biopost control
Use of Non-Conventional Sources of Energy:
Conventional sources of energy like thermal power and hydropower are highly damaging to the environment. Thermal power is generated by burning coal. This releases carbon dioxide which adds to global warming. Hydropower generation requires construction of dams. This leads to deforestation and submerging of forest and agricultural lands. Sustainable development requires extensive use of non-conventional sources of energy like solar, wind, tide, etc.
Sustainable development should minimize environmental problems. It should meet the needs of the present generation without compromising the prospects of future generations.
Question 29.
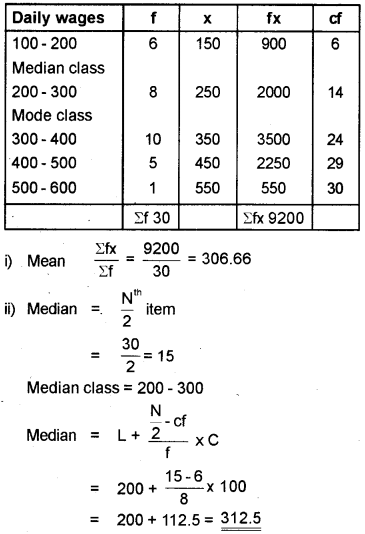
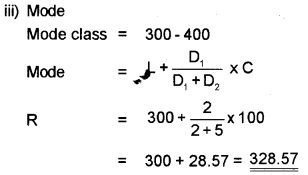
Calculate the Mean, Median and Mode from the following data.
| Daily Wages | No. of workers |
| 100 – 200 | 6 |
| 200 – 300 | 8 |
| 300 – 400 | 10 |
| 400 – 500 | 5 |
| 500 – 600 | 1 |
Answer:
