ISC Economics Previous Year Question Paper 2019 Solved for Class 12
Maximum Marks: 80
Time allowed: 3 hours
- Candidates are allowed additional 15 minutes for only reading the paper.
- They must NOT start writing during this time.
- Answer Question 1 (Compulsory) from Part I and five questions from Part II.
- The intended marks for questions or parts of questions are given in brackets [ ].
Part – I (20 Marks)
Answer all questions.
Question 1.
Answer briefly each of the following questions (i) to (x). [10 × 2]
(i) What is meant by product differentiation in monopolistic competition?
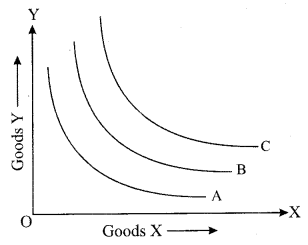
(ii) Explain an indifference map, with the help of a diagram.
(iii) Give two examples of each of the following:
(a) Revenue receipts of the government.
(b) Revenue expenditure of the government.
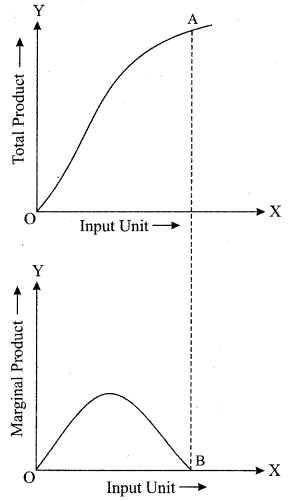
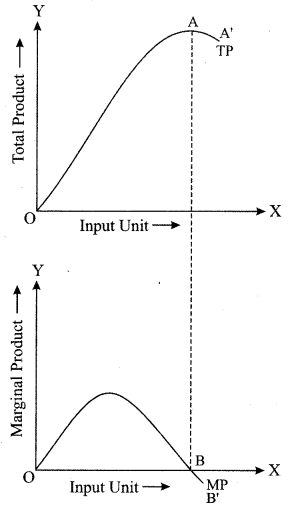
(iv) With the help of a diagram, state the behaviour of MP when:
(a) TP of the variable factor reaches a maximum.
(b) TP of the variable factor falls.
(v) What is meant by High Powered Money?
(vi) Distinguish between depreciation and devaluation.
(vii) Explain any two precautions to be taken while calculating national income by income method.
(viii) Differentiate between accounting cost and opportunity cost.
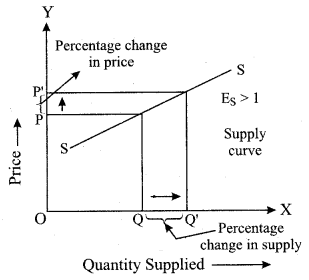
(ix) With the help of diagrams, show when the elasticity of supply is:
(a) greater than one
(b) equal to one
(x) What is meant by investment multiplier?
Answer:
(i) Product differentiation is a unique feature of monopolistic competition. Products of different firms are similar in nature but are differentiated in terms of brand name, shape, size, colour etc. For example, different brands of toothpaste vary on the basis of colour, taste, packaging etc. The essence of product differentiation is to create an image in the minds of buyer that the product sold by one seller is different from the product sold by another seller. It allows producers to determine the price policy for their goods independently.
(ii) An indifference map represents several indifference curves that can occur as a change in quantity or the type of good consumed changes the consumption pattern for consumers. A consumer receives same level of utility from different combination of goods that lie on the same indifference curve. An indifference curve that is further away from the origin indicates higher consumption and higher utility. An illustration of an indifference map is shown below:
(iii) (a) The revenue receipts of the government include taxes and the amount received from the sale of equity.
(b) The revenue expenditures of the government include interest payments and expenditure on subsidies.
(iv) (a) When TP of a variable factor reaches the maximum, the MP of the variable factor becomes zero. It is shown in the diagram below. When TP of a variable factor becomes maximum at point A, the MP of the variable factor touches the X-axis at point B.
(b) When TP of a variable factor falls, the MP of the variable factors becomes negative and the negative returns to scale set in. The situation is shown in the diagram below. The TP falls between point A and A’, and MP becomes negative between point B and B’.
(v) High powered money refers to the total monetary liability of the authorities (RBI and Central Government in India) of the country. It consists of currency (notes and coins in circulation and cash reserve of a commercial bank) and deposits held by the government of India and commercial banks with RBI. These are the claims which general public, Government or banks have on RBI and hence are considered as a liability of RBI.
Thus H = C + R + OD
where H = High powered money
C = Currency held by the Public
R = Government and bank deposits with RBI.
OD = Other deposits.
(vi) The difference between depreciation and devaluation is as follows:
| Depreciation | Devaluation |
| 1. Depreciation of currency occurs when the value of currency reduces in terms of another currency due to the market forces of demand and supply in the global market. | 1. Devaluation of currency occurs when the government of a country reduces the value of its currency in terms of another currency by increasing the supply of domestic currency in the global market. |
| 2. Depreciation of currency happens under the floating exchange rate system. | 2. Devaluation of currency happens under the fixed exchange rate system. |
(vii) Two precautions to be taken while calculating national income by income method are as follows:
(a) Transfer incomes such as pension and unemployment remittances should not be considered as income and should not be included in the calculation of national income. Only income earned by providing productive services must be included in the calculation of national income.
(b) The sale and purchase of second-hand goods should not be included in the calculation of national income by income method. This is because such goods are not a part of production in the current year. However, the commission earned through a trade of such goods is included in national income as the commission is income earned through productive services rendered in the current year.
(viii) The difference between accounting cost and opportunity cost is as follows:
| Accounting Cost | Opportunity Cost |
| 1. Accounting costs refer to the costs recorded in the books of account of a firm. These are the expenditures incurred by a firm in the production process. For example, if a firm manufactures tables, the cost of labour used in the production of the table is accounting cost. | 1. Opportunity cost refers to the value of the next best alternative selected over another. For example, the producer can use the building for either manufacturing tables or producing gloves. The producer decides to use the building for manufacturing tables, then the income that the producer could have earned from using the building by producing gloves is the opportunity cost of producing tables. |
| 2. Accounting costs are explicit costs. | 2. Opportunity cost is the sum of explicit cost and implicit costs. |
(ix) (a) When the elasticity of supply is greater than one, the percentage change in quantity supplied is greater than the percentage change in price.
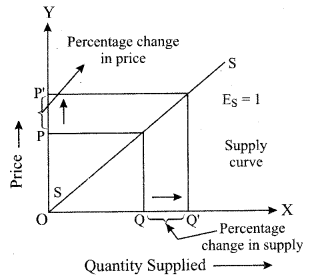
(b) When the elasticity of supply is equal to one, the percentage change in quantity supplied is equal to the percentage change in price.
(x) An investment multiplier refers to the fact that an increase in private or public investment expenditure leads to a more than proportionate increase in the level of national output. The investment multiplier is calculated as the ratio of change in income to the change in investment. Investment multiplier = ∆Y/∆I
where ∆Y = change in income
∆I = change in investment.
Part – II (60 Marks)
Answer any five questions.
Question 2.
(a) How does an increase in income affect the demand for the following: [3]
(i) A normal good
(ii) An inferior good
(b) Discuss any three reasons for the leftward shift of a supply curve. [3]
(c) Explain how a consumer attains equilibrium using indifference curve analysis. [6]
Answer:
(a) (i) An increase in. income leads to a higher demand for a normal good. This is because there is a positive relationship between the income of a consumer and the quantity demanded of a normal good. Therefore, an increase in income will lead to a rightward shift in the demand curve of a normal good.
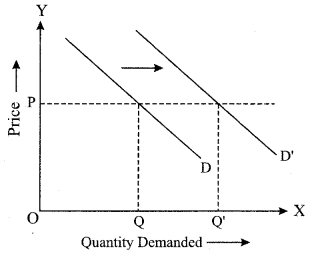
The original demand curve is depicted as D. However, when the income of the consumer increases, the quantity demanded of normal good increases and the demand curve shifts to D’. This implies that now a consumer will demand more of a commodity even at the same price.
(ii) An increase in income leads to lower demand for an inferior good. This is because there is a negative relation between the income of a consumer and the quantity demanded of an inferior good. Therefore, an increase in income will lead to a leftward shift of the demand curve of the inferior good.
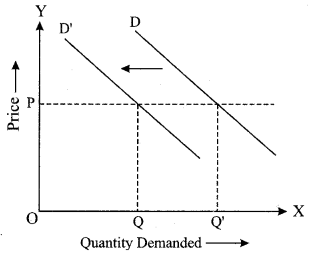
The original demand curve is depicted as D. However, when the income of the consumer increases, the quantity demanded of inferior good decreases and the demand curve shifts to D’. This implies that consumer demand less of the commodity at the same price.
(b) Three reasons that can lead to a leftward shift of a supply curve are as follows:
(i) The prices of related goods: Sometimes producers produce more than one good. Suppose a producer produces butter. If the price of butter decreases, the supply of butter and buttermilk will decrease. This is because buttermilk is made from butter. Therefore, a decrease in price of butter will lead to a lower supply of buttermilk, which is depicted by a leftward shift of the supply curve of buttermilk.
(ii) The prices of factors of production: If the cost of any of the factors of production such as land, labour, capital or entrepreneurship rises, the cost of producing a good also rises. As a result, the supply of the good decreases. Thus, the supply curve of the goodwill shift to the left.
(iii) Use of obsolete technology: The use of obsolete technology increases the time, effort and labour needed to produce a good. Thus, the production cost may increase which can lower the supply of the good. As a result, the supply curve shifts to the left.
(c) According to the indifference curve analysis, consumer equilibrium can be attained under two conditions.
(i) MRSXY = PX/PY
(ii) MRS is continuously diminishing
If MRSXY > PX/PY, the consumer is willing to pay more for good X than the market price of good X. Thus, the consumer buys a higher amount of good X, and the MRS diminishes till it becomes equal to the ratio of price of good X and price of good Y. At this point, equilibrium is attained.
If MRSXY < PX/PY, the consumer is willing to pay less for good X than the market price of good X. Thus, the consumer buys a lesser amount of good X, and the MRS increases till it becomes equal to the ratio of price of good X and price of good Y. At this point, equilibrium is attained.
The second condition to attain consumer equilibrium is that the MRS must be diminishing at an equilibrium point. This implies that at the point of equilibrium IC is convex to the origin.
Let us see the diagram given below:
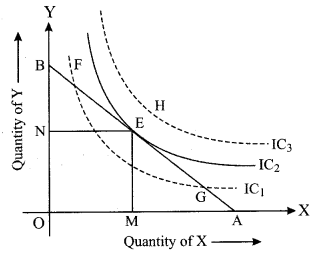
The indifference map depicts three indifference curves titled IC1, IC2 and IC3 respectively. Given the budget constraint of the consumer, the highest indifference curve that a consumer can reach is IC2. The budget line touches IC2 at point E, which is the equilibrium point. The points that lie to the left of point E lie on the lower indifference curve, i.e., IC2 and indicate lower satisfaction. The points to the right of point E lie on the higher indifference curve, i.e., IC3 which indicates the points that are outside the consumer’s budget. The budget line can be tangential to the Indifference Curve at a unique point where MRXXY = PX/PY and MRS is diminishing.
Question 3.
(a) Discuss two differences between returns to scale and returns to a variable factor. [3]
(b) With the help of a diagram, explain the relationship between AR and MR of a firm under imperfect competition. [3]
(c) Discuss any four features of monopoly market. [6]
Answer:
(a) Two differences between returns to scale and returns to a variable factor are as follows:
| Returns to Scale | Returns to Variable Factor |
| 1. Returns to scale indicate the change in the level of output when all factors of production are changed in the same proportion simultaneously. | 1. Returns to a variable factor indicate the change in the level of output when the amount of one variable factor used is changed without altering the level of other factors of production. |
| 2. Returns to scale occur over the long run. | 2. Returns to a variable factor can be experienced over the short run. |
| 3. In returns to scale, the ratio of variable factors to fixed factors does not change. | 3. In returns to a variable factor, the ratio of variable factors to fixed factors changes as the amount of a variable factor used is altered and the amount of fixed factors used remains constant. |
| 4. The three stages of returns to scale are increasing returns to scale, constant returns to scale and diminishing returns to scale. | 4. The three stages of returns to a variable factor are increasing returns to a variable factor, diminishing returns to a variable factor and negative returns to a variable factor. |
(b) The relationship between AR and MR of a firm under imperfect competition is given below:
Both Monopoly and Monopolistic Competition fall under the category of Imperfect Competition. Therefore, AR and MR curves slope downwards as more units can be sold only by reducing the price. However, there is one major difference between AR and MR curves of monopoly and monopolistic competition.
Under monopolistic competition, the AR and MR curves are more elastic as compared to those of Monopoly. It happens because of the presence of close substitutes under monopolistic competition and the absence of close substitutes under monopoly. So, when the price of a commodity is increased in both the markets, then proportionate fall in demand under monopoly is less than proportionate fall in demand under monopolistic competition.
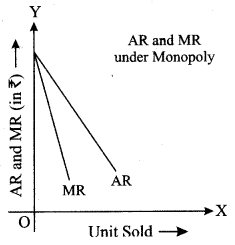
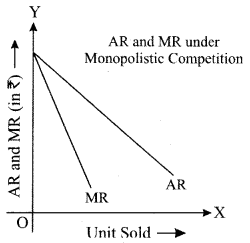
(c) The features of monopoly market are as follows:
(i) Single seller and a large number of buyers: A monopoly has a single seller or a group of sellers that together sell a good. Therefore, a monopoly has a single firm. However, there are a large number of buyers in a monopoly market. The buyers cannot influence the price of the product.
(ii) Barriers to entry: A monopoly market has high barriers or restrictions on the entry of the new firm. This is because monopolies tend to have exclusive rights over certain resources or patent rights.
(iii) Unique goods: The goods supplied by a monopolist are unique, and there are no close substitutes of these goods.
(iv) High control over prices: As a monopoly market has a single seller, the seller has a high degree of control over the price.
(v) Price discrimination: A monopolist can undertake price discrimination to earn higher profits. Price discrimination refers to charging different price from different consumers for the same good. For example, the price of an amusement park’s ticket can be different for children, adults and elderly people.
Question 4.
(a) Explain the various degrees of price elasticity of demand at different points on a straight-line demand curve. [3]
(b) Show with the help of a diagram, how a perfectly competitive firm earns normal profit in short-run equilibrium. [3]
(c) Explain with the help of diagrams how equilibrium price changes when there is a simultaneous increase of both, demand and supply. [6]
Answer:
(a) The elasticity of demand varies across a straight-line demand curve. To measure the elasticity of demand along a straight-line demand curve, the following formula is used.
Ed = Lower segment of the demand curve/Upper segment of the demand curve.
Let us see the diagram below.
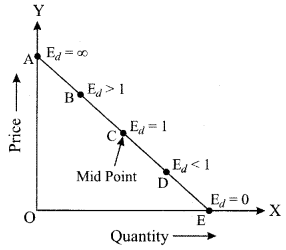
In this diagram, point C divides the demand curve into two equal halves, therefore, the elasticity of demand at point C is 1.
Ed = CE/AC, where CE = AC.
At point A, Ed = infinity. At point A, the demand curve touches the Y-axis, so Ed = AE/0.
At point E, Ed = 0. At point A, the demand curve touches the X-axis, so Ed = 0/AE.
At point B, Ed > 1. This is because the lower segment BE is greater than the upper segment AB. Ed = BE/AB.
At point D, Ed < 1. This is because the lower segment DE is smaller than the upper segment AB. Ed = DE/AD.
(b) A perfectly competitive firm can incur normal profits in short-run at a point where MR = MC and short-run MC is rising. At the point of equilibrium, AR = AC implying a situation of normal profits. Let us see the diagram below.
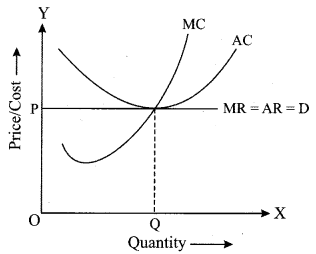
The normal profits are attained at point Q, where short-run AR = short-run AC and short-run AC is rising.
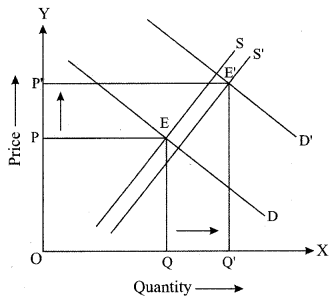
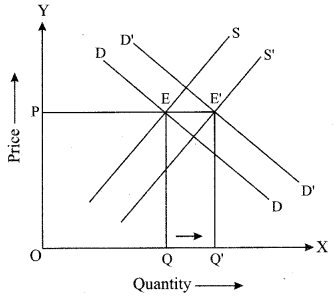
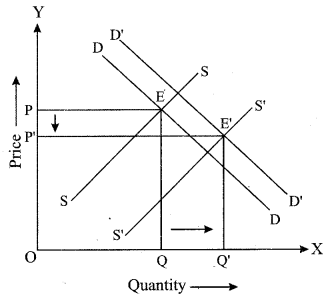
(c) There can be three scenarios when the demand and supply increase simultaneously. The first scenario is when the increase in demand is more than the increase in supply. The second case is when an increase in demand is equal to the increase in supply. The third case is when an increase in demand is less than the increase in supply.
Case 1: Increase in demand is more than the increase in supply:
When the increase in demand is greater than the increase in supply, there is a simultaneous increase in both the equilibrium quantity and equilibrium supply. In the diagram given below, the original equilibrium is attained at point E where the demand curve D intersects with supply curve S. When the demand increases from D to D’ and the supply increases from S to S’, the new equilibrium is attained at E’ with higher equilibrium price and higher equilibrium quantity.
Case 2: Increase in demand is equal to the increase in supply:
When the increase in demand is equal to the increase in supply, there is an increase in quantity exchanged at the new equilibrium. However, the price remains the same. In the diagram given below, the original equilibrium is attained at point E where the demand curve D intersects with supply curve S. When the demand increases from D to D’ and the supply increases from S to S’, the new equilibrium is attained at E’ with higher equilibrium quantity and same equilibrium price.
Case 3: Increase in demand is less than the increase in supply:
When the increase in demand is less than the increase in supply, there is a decrease in price and an increase in quantity exchanged in the market. The price decreases because the supply exceeds the demand and there is surplus quantity in the market. In the diagram given below, the original equilibrium is attained at point E where the demand curve D intersects with supply curve S. When the demand increases from D to D’ and the supply increases from S to S’, the new equilibrium is attained at E’ with lower equilibrium price and higher equilibrium quantity.
Question 5.
(a) Discuss any two exceptions to the law of demand. [3]
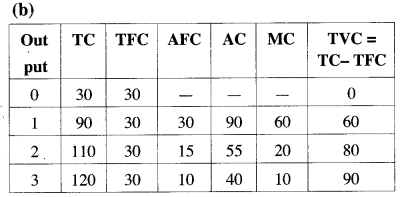
(b) Study the cost function of a firm given below:

Calculate:
(i) AFC
(ii) AC
(iii) MC
(c) A producer is in equilibrium when MR = MC. Explain this statement with the help of a diagram. [6]
Answer:
(a) Two exceptions of the law of demand are as follows:
(i) Giffen goods: Giffen goods refer to the goods for which the demand increases as the price of the good increases. For example, if the price of an essential good such as wheat increases, consumers with lower incomes are left with less money to buy other expensive goods. So, they are forced to consume more wheat.
(ii) Veblen goods: Veblen goods are the goods for which the demand tends to increase as the price increases. This is because some people believe to attain higher utility from goods that are priced more. For example, diamonds are considered to be Veblen goods. Veblen goods tend to have higher prestige value and mostly the luxury goods are considered as Veblen goods. Such goods are mainly considered as representative of wealth by the people.
(c) Producers are at equilibrium when they earn the maximum profit., i.e. the difference between total revenue and the total cost is the highest. According to marginal revenue and marginal cost approach, producers are in equilibrium when MR = MC and MC intersects the MR curve from below.
MR is the additional output earned by selling one more unit of output. MC is the additional cost incurred by producing one more unit of output. Producers compare MR and MC to maximise profits.
It is profitable for producers to produce and sell an additional unit of output as long as the additional revenue earned is greater than the additional cost incurred.
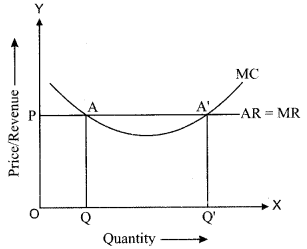
In the diagram, the quantity is shown on the X-axis and revenue is shown on the Y-axis. MC is U-shaped and AR = MR.
MR is equal to MC at two points: A and A’. However, the profit is maximised at the point A’, which corresponds to an output level of OQ’. Between the output levels OQ and OQ’, MR is greater than MC. Therefore, it is profitable for the firm to produce additional output. Therefore, producers are at equilibrium when MR = MC and MC intersects the MR curve from below. After the output level, OQ’, MC is greater than MR. Therefore, if producers continue to produce beyond OQ’, they will incur losses.
Question 6.
(a) Explain how public expenditure can be used as an instrument of fiscal policy to solve the problem of [3]
(i) Income inequality
(ii) Inflation
(b) Differentiate between the revenue and capital components of the union budget. [3]
(c) Discuss briefly the various components of the balance of payment. [6]
Answer:
(a) (i) Public expenditure includes government expenditure on public works, subsidies, relief works and transfer payments. Such expenditures help in generating income and creating employment, which helps in reducing the income gap in society.
(ii) Inflation occurs when there is increased spending in the economy. To control inflation, the government can lower public expenditure. This results in a reduction in aggregate demand which helps in controlling inflationary pressures. Controlling aggregate demand leads to lower growth and hence lower inflation.
(b) The difference between revenue and capital components of the union budget are as follows:
| Revenue Components | Capital Components |
| 1. The revenue component of the union budget comprises revenue receipts and revenue expenditure of the government. The revenue receipts include revenue generated from taxes, excise duty and interest receipts. The revenue expenditures include interest payment, expenditure on salaries and expenditure on defence. | 1. The capital component of the union budget comprises capital receipts and capital expenditure of the government. The capital receipts include loans taken by the government and selling of its shares by the government. The capital expenditures include the purchase of shares, expenditure on machinery, land and building. |
| 2. The revenue receipts do not reduce the financial assets or create any liabilities for the government. The revenue expenditure does not create an asset for the government or reduce liabilities of the government. | 2. The capital receipts reduce financial assets and create liabilities for the government. The capital expenditure create assets for the government and reduce liabilities of the government. |
(c) The components of the balance of payment are as follows:
1. Current account: The current account of BOP records the transactions related to exports and imports of goods and services and unilateral transfers from and to the rest of the world. The current account of BOP records the following components:
(i) Visible trade: Visible trade is the net export and import of goods. The balance of visible trade is referred to as the trade balance.
When imports of goods are higher than the export of goods, there is a trade deficit. When the export of goods are higher than the import of good, there is a trade surplus.
(ii) Invisible trade: Invisible trade accounts for net exports and imports of services. Services include shipping, banking and insurance etc.
(iii) Unilateral transfers to and from abroad: Unilateral transfers refer to payments that are provided to or received from the rest of the world as financial aid, gifts and remittances. Unilateral transfers are not factor payments.
(iv) Income receipts and payments: Income receipts and payments include factor payments and receipts. For examples, it includes rent on the property, profits on investments and interest on capital.
2. Capital account: The capital account of BOP records all transactions of a country that alter the status of assets and liabilities of a country. The capital account of BOP records the following components:
(i) Loans to and borrowings from abroad: This component consists of all loans and borrowings given to or received from the rest of the world. It includes both private sector loans and public sector loans.
(ii) Investments to and from abroad: This component includes investments made by non-residents in shares and equities in a country or investment in real estate in any country. The former investment does not provide any control over the asset and is known as portfolio investment. The latter investment provides control over the asset and it is known as foreign direct investment.
3. Autonomous and accommodating items: Autonomous and accommodating items are used to ensure that BOP balances are maintained. These are used to account for errors and discrepancies in BOP account.
Question 7.
(a) Discuss any two limitations of credit creation by commercial banks. [3]
(b) Explain two secondary functions of money.
(c) Discuss any two qualitative methods and any two quantitative methods of credit control used by the Central Bank. [6]
Answer:
(a) Limitations of credit creation by commercial banks are as follows:
(i) Monetary policy of the central bank: Though commercial banks create credit, the circulation of credit is controlled by the central bank in an economy. The central bank uses various techniques to control credit circulation from time to time and thus influence commercial banks’ capacity to create credit.
(ii) Borrowing habits of people: Commercial banks have sufficient funds to lend, however, not everyone in the economy borrows from banks. If fewer people borrow money from banks, leaser credit is created by commercial banks.
(b) Two secondary functions of money are as follows:
(i) Store of value: Money functions as a store of value which means that money holds it’s valued over a period of time. Money resolves the problem of double coincidence of wants because money can be stored over time and it does not lose its value. Though money is not the only store of value as the same purpose can be served by land, gold, etc., it is the most liquid medium of exchange.
(ii) Standard of deferred payments: The payments to be made in a future period are referred to as deferred payments. Money has eased the deferred payments. When money is borrowed from someone, it has to be returned with the interest payment. Keeping an account of these payments in terms of goods is very difficult. For instance, if a farmer borrows some wheat from a person, then it is very difficult to return this loan with interest in terms of wheat of the same quality.
(c) Two qualitative methods of credit control used by the central bank are as follows:
(i) Margin requirement: Margin requirement refers to the gap between the actual value of the security offered for a loan and the value of loan provided. Suppose an individual provides collateral worth ₹ 100 to the bank, and the bank grants a loan of ₹ 80 to the person. Here, the margin requirement is 20 per cent. If the central bank wants to lower the credit flow in the economy, the central bank increases the margin requirement. To increase the credit flow in the economy, the margin requirement is lowered.
(ii) Credit rationing: Credit rationing refers to imposing a quota on loans for certain activities. This measure is used when the central bank wants to check the flow of credit in some particular business activities such as speculative activities. The commercial banks cannot exceed the quota limit while providing loans.
Two quantitative measures of credit control used by the central bank are as follows:
(i) Open market operations: Open market operations refer to the sale and purchase of securities in the open market by the central bank. To lower the credit flow in the economy, the central bank sells securities in the economy. To increase the flow of credit, the central bank buys government securities from the open market.
(ii) Cash reserve ratio (CRR): Cash Reserve Ratio is the minimum percentage of a commercial bank’s total deposits that the bank has to keep with the central bank in the form of cash. Whenever the central bank has to decrease the credit flow in an economy, the central bank increases CRR. Whenever the central bank has to increase the credit flow in an economy, the central bank decreases CRR.
Question 8.
(a) What is meant by an average propensity to consume? Explain its relationship with average propensity to save. [3]
(b) Discuss any two fiscal measures to correct a situation of deficient demand in an economy. [3]
(c) Explain how the equilibrium level of income can be determined with the help of saving and investment approach. [6]
Answer:
(a) Average propensity to consume (APC) is the ratio of consumption expenditure and the level of income in an economy.
APC = C/Y
where
C = Consumption
Y = Level of income
APC indicates the percentage of income spent in the form of consumption expenditure in an economy. If the income of an economy is 100 crores and the consumption expenditure is 65 crores, then APC = 65/100 = 0.65. In this example, 65 per cent of income in the economy is spent in the form of consumption expenditure.
The relationship between APC and APS is described below:
The average propensity to save is the proportion of the income that is saved
APS = S/Y
where
S = Saving
Y = Level of income
We know that Y = C + S
Dividing the equation by Y throughout
1 = C/Y + S/Y
1 = APC + APS
The sum of Average propensity to consume and average propensity to save is equal to 1.
(b) Fiscal measures to correct deficient demand in an economy are discussed below:
(1) Increase in government spending: Government spends money on public works that include infrastructural activities and administrative activities. To rectify deficient demand, the government should increase expenditure on public works such as the construction of highways, flyovers and buildings. Such expenditures increase employment opportunities and provide additional income to people. Increasing public expenditure will help to increase aggregate demand and correct the situation of deficient demand.
(ii) A decrease in taxes: Government collects revenue from people in the form of taxes. Higher taxes imply lower disposable income and lower ability to spend. Thus, to rectify the situation of deficient demand, the government can lower taxes, which help in increasing people’s disposable income. As a result, the ability to spend money goes up and the aggregate demand is likely to increase.
(c) Saving is a function of income, i.e., S = f(Y). Saving is positively related to income so the saving curve is upward sloping. At very low levels of income, saving can be negative. This is because at low levels of income, consumption can be more than income and there can be dissaving in the economy. We will consider the investment to be autonomous, and thus, the investment curve is a horizontal line parallel to the x-axis.
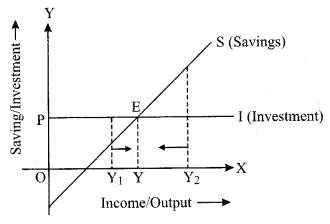
In the diagram, point E is the equilibrium point where S = I. At this point, the amount of money withdrawn from the economy is equal to the amount of money injected into the economy. At this level AD = AS in the economy.
When S > I, some of the planned output remains unsold and producers have to hold the stocks of unsold goods. To clear the stocks, producers will reduce the production and the level of output goes down. Thus, the income in the economy reduces. Lesser income indicates lesser savings and the process will continue till saving becomes equal to investment.
When S < I, people are spending more money than is required to purchase the planned output. This implies AD exceeds AS in the economy. As a result, producers will plan a higher output to cope with the situation. Thus, investment increases up to the point where it becomes equal to investment.
Question 9.
(a) Draw a well-labelled diagram to show a circular flow of income in a two-sector model. What happens to the flow of income when savings equal investment? [3]
(b) What is meant by economic welfare Explain how GDP is an indicator of economic welfare. [3]
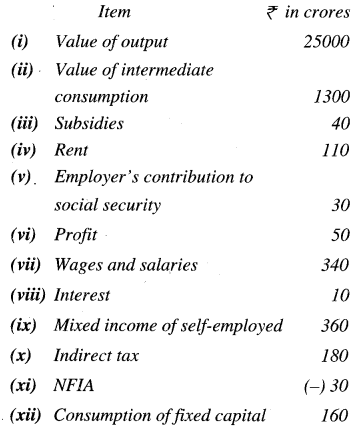
(c) From the following data, calculate National Income by Output method and Income method: [6]
Answer 9.
(a) The two-sector circular flow model is shown below. The domestic economy has two sectors which are producers or firms and households. The households provide labour, capital and entrepreneurship to firms and the firms make payments to household in return. The households spend income on consumer goods and services which are produced by the firms.
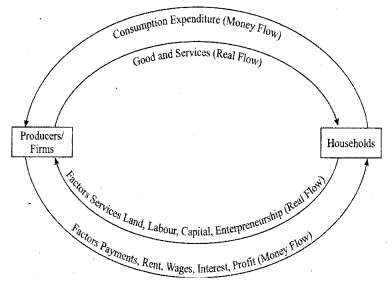
Money flows from firms to households as payments to factor inputs, and then money flows from households to firms. Therefore, there is a circular flow of money. When S=I in a two-sector model, the circular flow of income in the economy continues unabated. The withdrawal of money from the income stream by savings should be offset by the injection of money through investment expenditure. A constant money income flow in an economy is to be obtained when planned saving equals planned investment.
(b) Economic welfare refers to the level of prosperity and quality of living standards in an economy. Economic welfare can be measured through a variety of factors such as GDP and other indicators which reflect the standard of living of people through the level of literacy, level of health facilities, and quality of the environment. GDP is not a robust measure of economic welfare. GDP is an indicator of the standard of living of people in a country. GDP does not directly account for leisure, levels of literacy and health, environmental quality, changes in inequality of income, improvements in technology. However, GDP tends to have a positive relationship with factors that indicate economic welfare. So, a higher GDP is likely to indicate a higher standard of living and economic welfare.
(c) (i) National Income by Output method = value of output – Value of intermediate consumption – consumption of fixed capital – Indirect taxes + subsidies + Net factor income from abroad.
= ₹ [2500 – 1300 – 160 – 180 + 40 + (-30)] crore
= ₹ 870 crores.
(ii) National Income by Income method = Wages and salaries + Rent + Profit + Interest + social security contribution + Net factor income from abroad + Mixed-Income of self employed.
= ₹ [340 + 110 + 50 + 10 + 30 + (-30) + 360] Crore.
= ₹ 870 crores.
