ISC Economics Previous Year Question Paper 2018 Solved for Class 12
Maximum Marks: 80
Time allowed: 3 hours
- Candidates are allowed additional 15 minutes for only reading the paper.
- They must NOT start writing during this time.
- Answer Question 1 (Compulsory) from Part I and five questions from Part II.
- The intended marks for questions or parts of questions are given in brackets [ ].
Part – I (20 Marks)
Answer all questions.
Question 1.
Answer briefly each of the following questions (i) to (x):
(i) Define deficit financing.
(ii) Differentiate between Current Account and Capital Account of Balance of Payment.
(iii) What is meant by price discrimination in the monopoly market?
(iv) Define total utility. How is marginal utility derived from total utility?
(v) Explain the overdraft facility given by banks.
(vi) Define implicit cost. How is it different from explicit cost?
(vii) Why is price per unit equal to AR and MR under perfect competition?
(viii) Explain the meaning of the following:
(a) Full employment
(b) Involuntary unemployment.
(ix) Explain two differences between factor income and transfer income.
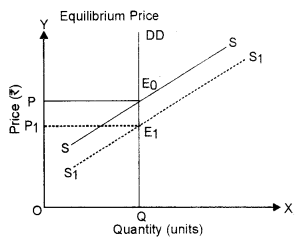
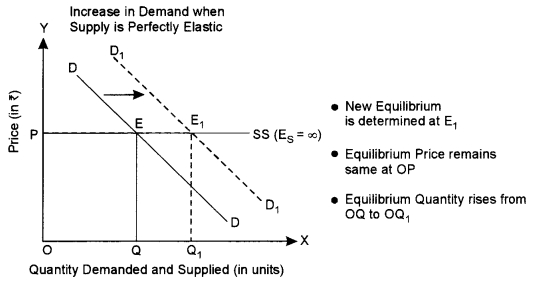
(x) With the help of diagrams, show how equilibrium price and quantity of a commodity are affected when:
(a) Demand is perfectly elastic and supply decreases.
(b) Supply is perfectly elastic and demand increases.
Answers:
(i) Deficit financing is a budgetary situation when government expenditure is higher than the revenue and the difference is made up by borrowing or uniting new funds.
(ii)
| Current Account | Capital Account |
| (i) It records exports and imports of goods and services as well as unilateral transfers. | (i) It records transactions of purchase and sale of foreign assets and liabilities. |
| (ii) It has a direct influence on the level of income of a country. | (ii) It does not have a direct influence on the level of income of a country. |
| (iii) It includes all items of a flow nature so it is a flow concept. | (iii) It includes all items expressing changes in stock, hence it is a stock concept. |
(iii) A monopolist may charge different prices for his product from different sets of consumers at the same time. It is known as Price Discrimination.
(iv) It is the sum total of marginal utilities derived from the consumption of different units of a commodity.
TUn = U1 + U2 + ….+ Un
Marginal utility is the net addition made to total utility by the consumption of an additional unit.
Mun = TUn – TUn-1
(v) An overdraft allows the individual to continue withdrawing money even if the account has no funds in it or not enough to cover the withdrawal. Basically, overdraft means that the bank allows customers to borrow a set amount of money.
(vi) Implicit cost refers to the cost of self-supplied factors or the factors owned and employed by the firm itself, e.g., the salary of an entrepreneur. Whereas explicit cost is the expense incurred for outside payment or hired factors.
(vii) Under perfect competition, AR or price remains fixed. So. MR will always be constant.
(viii) Full employment: It is a situation in which all those people who are willing to work at the prevailing wage rate get work.
Involuntary unemployment: Involuntary unemployment is a situation in which people are able to work and willing to work at existing rate of wages but do not get work.
(ix)
| Basis | Factor Income | Transfer Income |
| Definition | It refers to income received by factors of production for rendering factor services in the production process. | It refers to income received without rendering any productive sendee in return. |
| Nature | It is included in both National Income and Domestic Income. | It is neither included in National Income nor in Domestic Income. |
(x) (a) When supply increases, the supply curve shifts to the right from SS to S1S1. DD is a vertical straight line parallel to the Y-axis. Due to an increase in supply, the new equilibrium is established at point E1. Equilibrium price falls from OP to OP1 but equilibrium quantity remains the same at OQ as demand is perfectly inelastic.
(b) When demand increases, the demand curve shifts to the right from DD to D1D1 (Fig. below). Supply curve SS is a horizontal straight line parallel to the X-axis. Due to the increase in demand for the product, the new equilibrium is established at E1 Equilibrium quantity rises from OQ to OQ1 but equilibrium price remains the same at OP as supply is perfectly elastic.
Part – II (60 Marks)
Answer any five questions.
Question 2.
(a) Differentiate between the contraction of demand and decrease in demand, using diagrams. [3]
(b) “The supply curve of labour is an exception to the law of supply.” Justify the statement, using a diagram. [3]
(c) A consumer consumes goods X and Y. Given below is his marginal utility schedule for goods X and Y. Suppose, the price of X is ₹ 2, Y is ₹ 1 and income ₹ 12. State the law of Equimarginal utility and explain how the consumer will attain equilibrium. [6]

Answers:
| Basis | Contraction in Demand | Decrease in Demand |
| Meaning | When the quantity demanded falls due to an increase in the price, keeping other factors constant, it is known as a contraction in demand. | When the demand falls due to an unfavourable change in the other factors, at the same price, it is known as a decrease in demand. |
| Effect on Demand Curve | There is an upward movement (see fig.) along the same demand curve. | There is a leftward shift (see fig.) in the demand curve. |
| Reason | It occurs due to an increase in the price of the given commodity.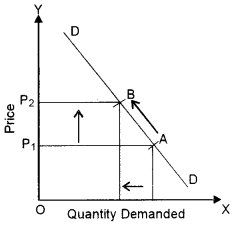 | It occurs due to an unfavourable change in the other factors like a decrease in the prices of substitutes, an increase in the prices of complementary goods, a decrease in income in case of normal goods, etc.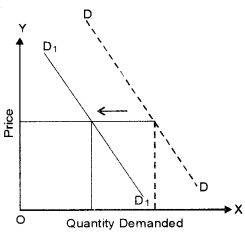 |
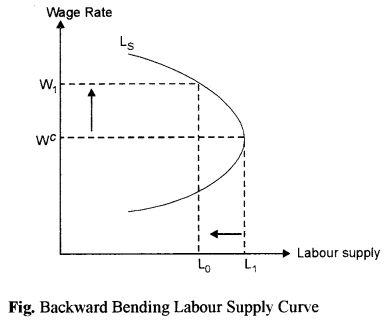
(b) Labour Supply: The law of supply is not applicable in case of labour supply. If the wage rate rises, after a certain level labour supply may fall in order to have more leisure. The supply curve in such a situation is backward bending.
In Fig. Ls is backward bending labour supply curve. Wc is the critical wage rate where L1 is the total labour supply. How ever, when the wage rate starts rising above Wc, the supply of labour will be reduced. At W1 wage rate, the labour supply will fall from L1 to L0. This is because after giving a considerable amount of labour, individual labour will prefer leisure at very high wage rate.
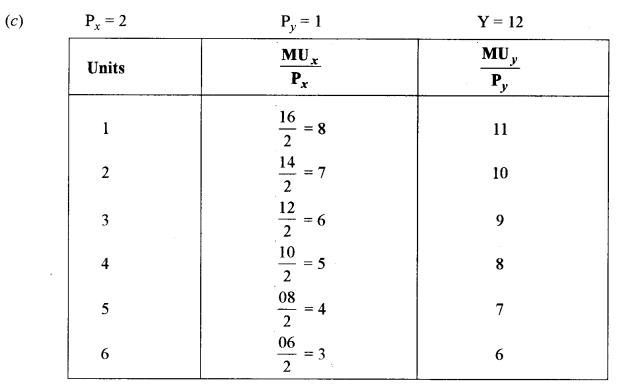
It is worth noting that in order to maximise his utility the consumer will equate marginal utilities of the goods because the prices of the two goods are different. He will equate the marginal utility of the last rupee (i.e., the marginal utility of money expenditure) spent on these two goods. In other words he will equate \(\frac{\mathrm{MU}_{x}}{\mathrm{P}_{x}} \text { with } \frac{\mathrm{MU}_{y}}{\mathrm{P}_{y}}\) while spending his given money income on the two goods. By looking at the table, it will become clear that \(\frac{\mathrm{MU}_{x}}{\mathrm{P}_{x}}\) equal to 8 units when the consumer purchases 1 unit of good X and \(\frac{\mathrm{MU}_{y}}{\mathrm{P}_{y}}\) is equal to 8 units when he buys 4 units of good Y. Therefore, a consumer will be in equilibrium when he is buying 1 unit of good X and 4 units of good Y and will be spending (₹ 2 × 4 + ₹ 1 × 4) = ₹ 12 on them. Thus, in the equilibrium position where he maximises his utility.
\(\begin{aligned} \frac{\mathrm{MU}_{x}}{\mathrm{P}_{x}} &=\frac{\mathrm{MU}_{y}}{\mathrm{P}_{y}}=\mathrm{MU}_{m} \\ \frac{16}{2} &=\frac{16}{2}=\frac{8}{1}=8 \end{aligned}\)
Thus, the marginal utility of the last rupee spent on each of the two goods he purchases is the same, that is 8 utils.
Question 3.
(a) Explain any two factors affecting the price elasticity of demand. [3]
(b) Derive a market supply curve from two hypothetical individual supply schedules. [3]
(c) If more variable factors are employed to fixed factors, the total product increases initially at an increasing rate and finally, it decreases. Explain this law with the help of a diagram. [6]
Answers:
(a) 1. Nature of commodities:
A. Necessaries: Demand for necessaries is less elastic. Without these commodities we can’t think of our existence, whatever may be the price, demand for necessaries remain stable.
B. Comforts: Price elasticity for comforts is a unitary elastic or equi proportionate change in price and demand.
C. Luxuries: Demand for luxuries is relatively more elastic.
2. Existence of substitutes: The greater ease with which substitute can be found for a commodity, the greater will be the price elasticity of demand and vice-versa.
(b) A market supply schedule is expressed as Sm = SA + SB + ………
Where Sm is the market supply and SA + SB +… are the individual supply of supplier A, supplier B and so on.
Let us understand the derivation of market supply schedule with the help of Table (Assuming, there are only 2 producers: A and B in the market):
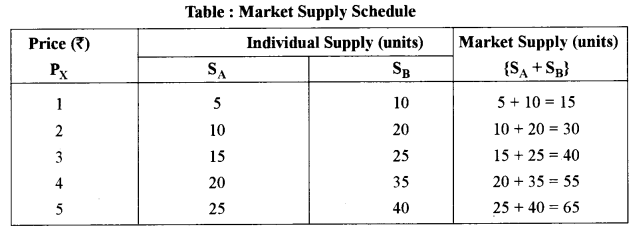
As seen in Table, market supply is obtained by adding the supplies of suppliers A and B at different prices.
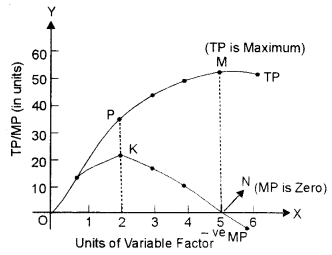
(c) This phenomenon is explained by Law of Variable Proportions (LVP) which states that as we increase the quantity of only one input keeping other inputs fixed, total product (TP) initially increases at an increasing rate, then at a decreasing rate and finally at a negative rate.
In the given diagram, the quantity of the variable factor has been measured on X-axis and Y-axis measures the total product on Y-axis. The diagram indicates, how the total product and marginal product changes as a result of increases in the quantity of one factor to a fixed quantity of other factors.
The law can be better explained through three stages.
(i) First stage:
Increasing Return to a Factor: In the first stage, every additional variable factor adds more and more to the total output. It means TP increases at an increasing rate and MP of each variable factor rises. Better utilisation of fixed factor and increases in the efficiency of a variable factor due to specialisation are the major factors responsible for increasing returns.
The increasing returns to a factor stage have been shown in the given diagram between O to P. It implies TP increases at an increasing rate (till point ‘P ) and MP rises till it reaches its ‘ maximum point ‘K’, which marks the end of the first phase.
(ii) Second stage:
Diminishing Returns to a Factor: In the second stage, every additional variable factor adds a lesser and lesser amount of output. It means TP increases at a diminishing rate and MP falls with an increase in the variable factor. The breaking of the optimum combination of a fixed and variable factor is the major factor responsible for diminishing return. The second stage ends at point ‘N’ when MP is zero and TP is maximum (point ‘M’).
The second stage is very crucial as a rational producer will always aim to produce in this phase because TP is maximum and MP of each variable factor is positive.
(iii) Third stage:
Negative Returns to a Factor: In the third stage, the employment of additional variable factor causes TP to decline. MP now becomes negative. Therefore, this stage is known as negative returns to a factor. Poor coordination between variable and fixed factor is the basic cause for this stage. In fig., the third stage starts after point ‘N’ on MP curve and point ‘M’ on the TP curve. MP of each variable factor is negative in the third stage. So, no firm would deliberately choose to operate in this stage.
Question 4.
(a) Explain the shapes of the total fixed cost curve and the average fixed cost curve. Give one reason each to justify the shape of the two curves. [3]
(b) Explain the concept of Maximum Price Legislation with the help of a diagram. [3]
(c) Explain any four features of perfect competition. [6]
Answers:
(a) Total Fixed Costs are those costs which remain unchanged with the change in the level of output. These costs are incurred even when the output is zero.
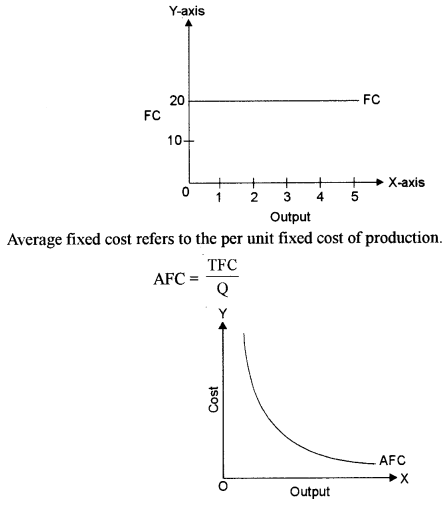
AFC falls with a rise in output because constant TFC is divided by increasing output. AFC curve is a rectangular hyperbola i.e., an area under the AFC curve remains the same at different points.
(b) Maximum Price Legislation or Price ceiling refers to fixing the maximum price of a commodity at a level lower than the equilibrium price. The ceiling is normally imposed on goods of mass consumption like wheat, rice, sugar, etc. In the diagram, demand curve DD and supply curve SS of wheat intersect each other at point E and as a result, the equilibrium price of OP is determined.
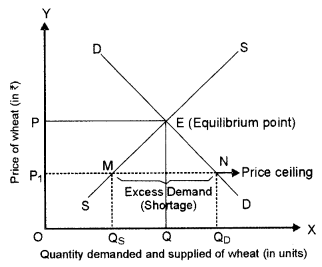
Suppose, the equilibrium price OP is very high and many poor people are unable to afford wheat at this price.
As wheat is an essential commodity, the government interferes and fixes the maximum price (known as Price ceiling) at OP1 which is less than the equilibrium price OP.
At this controlled price (OP1), the ‘s quantity demanded (OQD) exceeds the quantity supplied (OQS) by QSQD.
This is a case of excess demand. Excess demand may lead to black-marketing or hoarding.
(c) (i) Homogeneous product: Homogeneous product is a product which is identical in size, colour, packing etc. Due to this, all the firms become price taker.
(ii) Entry and Exit: Under perfect competition, a firm can enter or leave any industry. There are no legal restrictions on entry or exit. Accordingly, whenever there are supernormal profits, some new firms will enter the industry and in case of losses, some existing firms will leave the industry of course, in the long run.
(iii) A large number of buyers: Under perfect competition like a large number of sellers, the number of buyers is also very large. But like an individual firm or producer or seller, an individual buyer cannot influence the price of a commodity. Each buyer makes transactions in this market at a prevailing price.
(iv) A large number of sellers: Under perfect competition, the number of firms selling a particular commodity is so large that any increase or decrease in supply by an individual seller fails to impact the price of the commodity in the market. The individual seller can sell whatever amount it wishes to sell at the existing price of a commodity. All sellers in this market are price takers only.
Question 5.
(a) Explain how a firm in perfect competition incurs a loss, in short-run equilibrium. [3]
(b) Discuss how prices of related goods affect the demand for a commodity. [3]
(c) Explain how a producer attains equilibrium using the TR and TC approach. [6]
Answers:
(a) A firm can incur a loss in short-run when Price is lower than the SAC curve but greater than AVC.
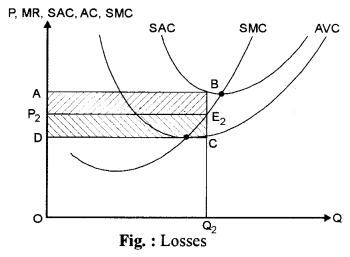
In Fig.,
E2 = Equilibrium point
P2 = Equilibrium price
Q2 = Equilibrium output
Total revenue (TR) = □ OP2E2Q2
Total cost (TC) = □ OABQ2
Loss = □ ABE2P2
Thus, whenever AVC < P < SAC, the firm incurs losses. Now the strategy of the firm is to minimise its loss. If the firm closes down, its loss is equal to the total fixed cost □ABCD in given fig.
(b) Related goods are of two kinds:
Substitute goods
Complementary goods
A change in the price of substitute directly affects the demand for a given commodity. When the price of substitute goods rises demand for the given commodity also rises.
An increase or decrease in the prices of complementary goods inversely affects the demand for the given commodity.
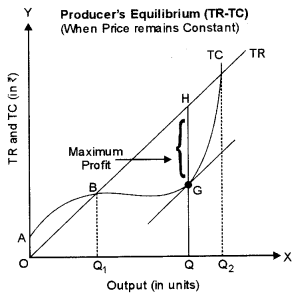
(c) Total Revenue – Total Cost Approach (TR – TC Approach)
A firm attains the stage of equilibrium when it maximises its profits, i.e., when he maximises the difference between TR and TC. After reaching such a position, there will be no incentive for the producer to increase or decrease the output and the producer will be said to be at equilibrium. According to TR – TC approach, producer’s equilibrium refers to a stage of that output level at which the difference between TR and TC is positively maximised and total profits fall as more units of output are produced. So, two essential conditions for the producer’s equilibrium are :
1. The difference between TR and TC is positively maximised.
2. Total profits fall after that level of output.
When price remains same at all output levels (like in case of perfect competition), each producer aims to produce that level of output at which he can earn maximum profits, i. e., when the difference between TR and TC is the maximum.
Let us understand this with the help of Table, where a market price is fixed at ₹ 10 per unit:
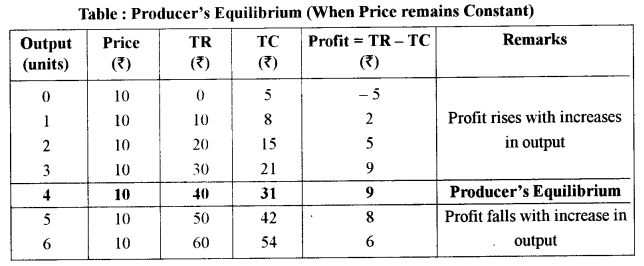
According to Table, the maximum profit of ₹ 9 can be achieved by producing either 3 units or 4 units. But, the producer will be at equilibrium at 4 units of output because, at this level, both the conditions of producer’s equilibrium are satisfied:
1. The producer is earning a maximum profit of ₹ 9;
2. Total profit falls to ₹ 8 after 4 units of output.
In Fig., Producer’s equilibrium will be determined at the OQ level of output at which the vertical distance between TR and TC curves is the greatest. At this level of output, tangent to TC curve (at point G) is parallel to the TR curve and difference between both the curves (represented by distance GH) is maximum.
Question 6.
(a) Discuss the mechanism of investment multiplier with the help of a numerical example. [3]
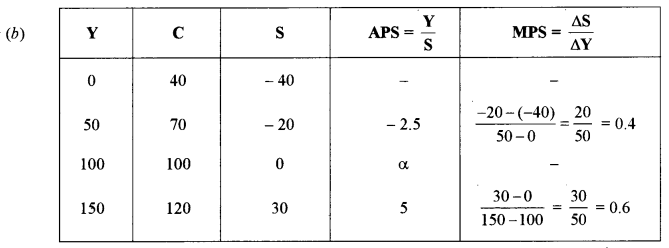
(b) Complete the following table: [3]

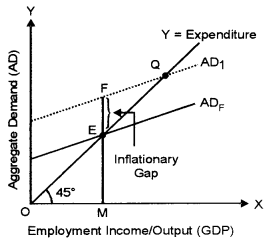
(c) Explain the concept of the inflationary gap with the help of a diagram. Discuss two monetary measures to correct it. [6]
Answer:
(a) Increase in investment in an economy generates a multiplier effect on its national income. The extent of multiplier effect (and therefore, the extent of the total increase in income) depends on the marginal propensity to consume (MPC). Higher the MPC, greater would be the multiplier effect and vice-versa.
Working of Multiplier:
An additional investment of ₹ 100 crores (ΔI) is made to construct a flyover. This extra investment will generate an extra income of ₹ 100 crores in the first round. But this is not the end of the story.
If MPC is assumed to be 0.90, then recipients of this additional income will spend 90% of ₹ 100 crores, i.e., ₹ 90 crores as consumption expenditure and the remaining amount will be saved. It will increase the income by ₹ 90 crores in the second round.
In the next round, 90% of the additional income of ₹ 90 crores, i. e., ₹ 81 crores will be spent on consumption and the remaining amount will be saved.
This multiplier process will go on and the consumption expenditure in every round will be 0.90 times of the additional income received from the previous round.
(c) Inflationary gap is the excess of aggregate demand over and above its level required to maintain full employment equilibrium in the economy.
Monetary measures to correct the inflationary gap:
(i) Cash Reserve Ratio: Cash Reserve Ratio is that percentage of bank deposits which are held as reserves with the Central Bank. Central Bank has the right to fix CRR. The Central Bank can reduce the inflationary gap by raising CRR. Raising CRR will reduce the lending capacity of the commercial banks. Lower lendings will leads to a fall in aggregate demand helpful in reducing inflation.
(ii) Repo Rate: In the case of inflation, RBI will try to reduce the amount of money in circulation by increasing the repo rate. When the repo rate is increased, banks will borrow less from RBI and hence the amount of money they will be lending to the public also decrease. A fall in the money supply means to fall in AD.
Question 7.
(a) Differentiate between Revenue deficit and Fiscal deficit. [3]
(b) What is an indirect tax? How is it different from a direct tax? [3]
(c) Show with the help of a diagram of how the exchange rate is determined under a flexible exchange rate system. [6]
Answers:
(a)
| Basis | Fiscal Deficit | Revenue Deficit |
| Meaning | It shows the excess of total expenditure over total receipts excluding borrowings. Fiscal Deficit = Total Expenditure – Total Receipts excluding borrowings | It shows the excess of revenue expenditure over the revenue receipts. Revenue Deficit = Revenue Expenditure – Revenue Receipts |
| Indicator | It measures the total borrowing requirements of the government. | It indicates the inability of the government to meet its regular and recurring expenditure. |
| Sources of Financing | Tax and non-tax revenue. | Borrowing and deficit financing. |
(b) A tax levied on goods and services rather than on income or profit is called an indirect tax.
A direct tax cannot be shifted whereas indirect tax may be shifted. For example, GST is an indirect tax and can be shifted whereas income tax is a direct tax and cannot be shifted.
(c) The flexible exchange rate is determined by the interaction of the forces of demand and supply. The equilibrium exchange rate is determined at a level where demand for foreign exchange is equal to the supply of foreign exchange. This will be clear from the given Diagram.
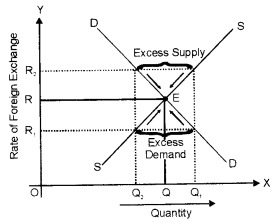
As seen in the diagram, demand and supply of foreign exchange are measured on the X-axis whereas the rate of foreign exchange on the Y-axis. DD is the downward sloping demand curve of foreign exchange and SS is the upward-sloping supply curve of foreign exchange. Both the curves intersect each other at point ‘E’. The equilibrium exchange rate is determined at OR and the equilibrium quantity is determined at OQ.
Question 8.
(a) Explain any two functions of the Reserve Bank of India. [3]
(b) Explain the follow ing terms: [3]
(i) Fiat money
(ii) Deposit money
(iii) Token money
(c) How do commercial banks create credit? Explain with the help of an example. [6]
Answers:
(a) (i) Issue of Currency: Central bank of a country has the exclusive right of issuing notes or it is the only currency authority. It is the sole agency of note-issuing in the country. Actually, till the beginning of the 20th century, the central bank was known as ‘Bank of Issue’. The notes issued by the central bank are an unlimited legal tender.
(ii) Lender of the Last Resort:
The Central Bank acts as the lender of the last resort.
When commercial banks fail to meet their financial requirements from other sources, they can approach the Central Bank which provides them with loan and advances as lender of the last resort.
The Central Bank provides this facility to protect the interest of the depositors and to prevent possible failure of the bank.
The commercial banks can borrow on the basis of approved securities.
(b) (i) Fiat money: Currency notes and coins is called fiat money as it serves as money on the fiat (order) of the government.
(ii) Deposit money: It is money deposited in a bank in saving or current or deposit accounts.
(iii) Token money: Notes or coins for which the value written on them is greater than the value of the materials they are made from.
(c) (i) Credit creation is one of the important functions of a commercial bank. It constitutes the major component of the money supply in the economy.
(ii) They create credit in the form of demand deposits.
(iii) The process of credit creation occurs when banks accept deposits and provide loans and advances. When the customer deposit money with the bank, they are called primary deposits. This money will not be withdrawn immediately by them.
(iv) Hence banks keep a certain amount of deposits as reserves which are known as Legal Reserves Ratio (Cash Reserve Ratio and Statutory Liquid Ratio) and provide the balance amount as loans and advances.
(v) Every deposit creates a loan. Commercial banks give loans and advances against some security to the public. But the bank does not give the loan amount directly. It opens an account in the name of the borrower and deposits the amount in that account. Thus, every loan creates a deposit. These deposits created by banks with the help of primary deposits are called derivative deposits.
This can be explained with an example.
Suppose Primary Deposits = ₹ 1,000
Cash Reserve Ratio = 10%
Bank can lend out = ₹ 900
i.e., Primary Deposit – Cash Reserve = Derivative Deposit.
₹ 1,000 – ₹ 100 = ₹ 900 (10% of 1000 is ₹ 100)
The bank will give the amount to his creditor only in his account which is opened in his name. The borrower can deposit the amount with the bank. The bank can lend out ₹ 810/- out of ₹ 900/-, which has come back to the bank in the second round as primary deposits. This process will continue and if there is no cash leakage the credit creation would be processed as in the below figure:

This process can be explained with a formula.
Total credit creation = Primary deposit × 1/CRR
Total credit creation = 1000 × 1/10/100
Total credit created = 1000 × 10 = 10000
Question 9.
(a) Explain the components of compensation of employees for the calculation of National Income by Income method. [3]
(b) Explain how the following are treated in estimating National Income: [3]
(i) Wheat is grown by a farmer for self-consumption.
(ii) Earnings of the shareholders from the sale of shares.
(iii) Services rendered by family members to each other.
(c) From the following data, calculate National Income by Income method and Expenditure method: [6]
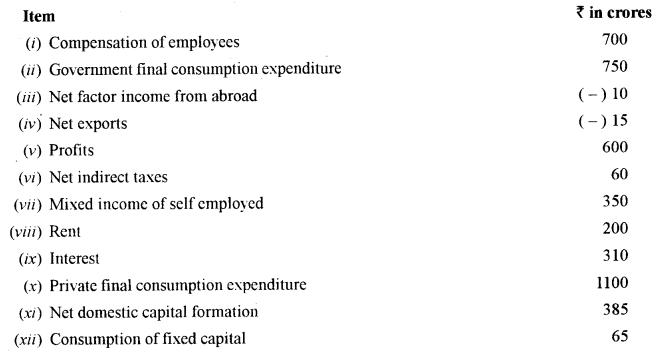
Answers:
(a) Compensation of Employees (COE): COE refers to the amount paid to employees by the employer for rendering productive services. It includes three elements:
(i) Wages and salaries in cash: It includes all monetary benefits, like wages, salaries, bonus, dearness allowances, commission, etc.
(ii) Wages and salaries in kind: It includes all non-monetary benefits like free residence, free car, free medical and educational facilities, etc. The imputed value of these benefits should be included in national income.
(iii) Employer’s contribution to social security schemes: It includes contributions made by the employer for the social security of employees. For example, contribution to provident fund, gratuity, labour welfare funds, retirement pension, etc. The aim of such contributions is to ensure the safety and security of life of the employees.
(b) (i) Wheat grown by a farmer but used entirely for family’s consumption is a part of the contribution by him to the value of goods produced. Therefore, this is included in national income.
(ii) Income from the sale of shares will not be included as such transactions do not contribute to the current flow of goods and services. These financial assets are mere paper claims and involve a change of title only.
(iii) Services rendered by family members to each other are not included in the estimating national income because family members are not paid for their services. Moreover, it is difficult to the market value of their services.
(c) Income Method
NDPFC = COE + OS + MI = 700 + (200 + 0 + 310 + 600) + 350 = 2160
NNPFC = NDPFC + NFIA = 2160 + (-10) = 2150
Expenditure Method
GDPMP = PFCE + GFCE + GDCF + Net Exports = 1100 + 750 + (385 + 65) + (-15) = 2285
NNPFC = GDPMP – Dep. + NFIA – NIT = 2285 – 65 + (-10) – 60 = 2150
