ISC Economics Previous Year Question Paper 2016 Solved for Class 12
Maximum Marks: 80
Time allowed: 3 hours
- Candidates are allowed additional 15 minutes for only reading the paper.
- They must NOT start writing during this time.
- Answer Question 1 (Compulsory) from Part I and five questions from Part II.
- The intended marks for questions or parts of questions are given in brackets [ ].
Part – I (20 Marks)
Answer all questions.
Question 1.
Answer briefly each of the following questions (i) to (x): [10 × 2]
(i) What is meant by income elasticity of demand?
(ii) Technical advancement leads to cost-saving. With the help of a diagram, explain the effect of technical advancement on the supply curve.
(iii) Explain the meaning of M1 and M4 supply of money.
(iv) With the help of a diagram, show how the equilibrium price can remain unchanged even after a rightward shift of the demand curve.
(v) What is meant by the fiscal policy? Name any two instruments of fiscal policy.
(vi) Give two differences between Current Account and Capital Account of Balance of Payment Account.
(vii) What is meant by budget line?
(viii) State whether each of the items given below is included in estimating National Income. Give a reason in each case to justify your answer.
(a) Expenditure on the construction of Express Highway.
(b) Expenditure on the purchase of an old house.
(ix) If the value of MPC is 0-9, find the value of the multiplier.
(x) Explain the meaning of social cost with the help of an example.
Answers:
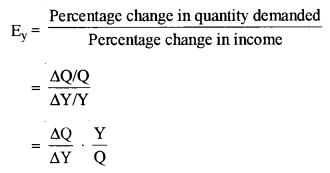
(i) Income elasticity of demand measures the degree of responsiveness of quantity demanded of a commodity to changes in income of the consumers, other things remaining constant.
(ii) Technical advancement reduces the cost of production and increases profit margin, thereby inducing the producers to produce more and increase the supply, at a given price.
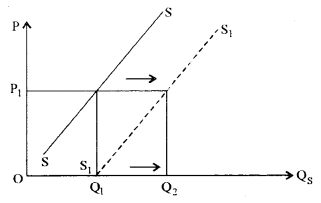
Thus, the supply curve shifts rightward from SS to S1S1 due to technical advancement. Quantity supplied increases by the amount Q1Q2.
(iii) The supply of money consists of various components. M1 and M4 are also components of the money supply.
M1 = Currency notes and coins with the public (C) + Demand deposits with the banks (DD) + Other deposits with the RBI (OD)
Thus. M1 = C + DD + OD
and M4 = M1 + Saving deposit with post office saving bank (SD) + Total deposits with post office savings organisation (TDP)
Thus, M4 = M2 + TDP
where M2 = M1 + SD.
(iv) A rightward shift in the demand curve, given the supply curve, the equilibrium price generally increases. However, if the supply curve is horizontal (a perfectly elastic supply of a commodity), then the equilibrium price remains unchanged even after a rightward shift of the demand curve.
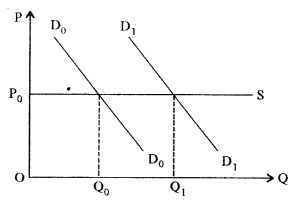
The demand curve shifts from D0D0 to D1D1 but the equilibrium price is OP0.
(v) Fiscal Policy is defined as the policy under which the government uses the instruments of taxation, public spending and public borrowing to achieve various objectives of economic development, like economic stability, high employment and accelerating economic growth. Two instruments of fiscal policy are:
- Taxation policy
- Public expenditure policy
- Public debt policy.
(vi)
| Current Account | Capital Account |
| (i) It records transactions relating to export and import of goods and services, unilateral transfers and international incomes. | (i) It records transactions relating to the change in assets – both financial and physical. |
| (ii) These do not change the assets and future liabilities of the country. | (ii) These increases or decreases the assets and future liabilities of the country. |
| (iii) It is the value of exports minus value of imports, adjusted for international incomes and net transfers. | (iii) It is the record of short term and long term capital transactions, both private and official. |
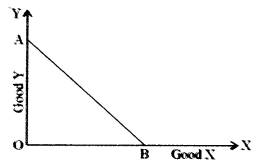
(vii) A budget line is a set of various combinations of two commodities (say, x and y) which a consumer can purchase given his money income and the prices of the two commodities. Here, AB is the budget line.
(viii) (a) It is included. This is because it is a part of the final investment expenditure.
(b) It is not included. This is because National income measures the value of currently produced goods and services Purchase of an old house is already included during the first rime.
(ix) MPC = 0.9.
We know,
MPC + MPS = 1
and Multiplier K = \(\frac { 1 }{ MPS }\)
MPS = 1 – 0.9 = 0.1
and K = \(\frac { 1 }{ 0.1 }\) = 10
(x) Social cost refers to the cost that the society has to bear on account of the production of a commodity. For example, a manufacturing firm produces chemical products, may pour industrial wastes in river water, without proper treatment, thus, saving private costs, but polluting the river water. So, the people taking bath in that river, or fishermen catching fishes from that river, would suffer. This is the social cost of producing chemical products. Several other examples are possible.
Part-II (60 Marks)
Answer any five questions.
Question 2.
(a) Explain any two reasons for the upward slope of the supply curve. [3]
(b) Explain the shape of the following: [3]
(i) Total fixed cost curve.
(ii) Total variable cost curve.
(c) Explain the concept of consumer’s equilibrium with the help of indifference curve analysis. [6]
Answers:
(a) The upward slope of the supply curve can be explained as:
(i) Price level determines the number of profits: Higher the price, larger is the profit that can be earned, ceteris paribus. This gives producers’ incentives to produce more and offer for sale, that is, supply in the market.
(ii) The marginal cost of production: It increases because of the law of diminishing returns, that is, increasing cost with an increase in production. Hence, the producer will be prepared to produce and supply more only at a higher price, so as to cover the higher cost of production.
(iii) An increasing cost industry: In the long run, higher prices may attract new firms in an industry. However, input costs may also increase. So, the new firms would be willing to supply more only at higher prices to cover higher costs of production. So, at higher prices, more firms produce well.
(b) (i) Total fixed costs: Costs involved in employing fixed factors are fixed costs. Rent on land, interest payment on loan capital, salaries paid to permanent employees, etc. are fixed costs. It remains constant at all output levels, even if production is zero.
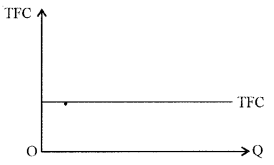
TFC curve becomes parallel to the output axis because TFC is constant at all levels of Q.
(ii) Total variable costs: Costs incurred by a firm on the use of variable factors are variable costs, like wage cost, cost of raw materials, payment for fuel and power used, etc. It is zero at zero output level.
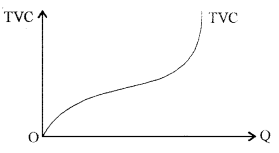
TVC curve looks like an ‘inverted S’ because it rises at a slow pace, initially and then increases at an increasing rate. This is due to the law of variable proportion.
(c) A consumer attains his equilibrium when he maximises his total utility, given his income and prices of two commodities. We draw the indifference curves and the budget line where the consumer maximises his total utility, subject to budget constraint.
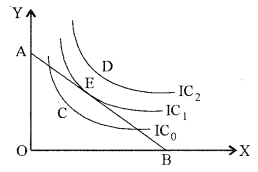
The consumer cannot purchase any combination which lies to the right of budget line AB. Such as combination ‘D’, because it is beyond his budget. However, any combination inside the budget line, say C, is within his reach. But any combination will not give him maximum total utility. Point E is a point, both, on the budget line and on a higher indifference curve (than C or any other point).
At the equilibrium point, the budget line of the consumer should be tangent to a particular indifference curve (here, E). Again, the tangent is the marginal rate of substitution. This is the condition for equilibrium.
The slope of budget line = Slope of the indifference curve
\(\frac{P_{x}}{P_{y}}=M R S_{X Y}\)
Hence, E is the consumer’s equilibrium point with AB as the budget line.
Question 3.
(a) The quantity demanded of a commodity at a price of ₹ 10 per unit is 40 units. Its price elasticity of demand is -2. The price falls by ₹ 2 per unit. Calculate the quantity demanded at the new price. [3]
(b) Discuss two differences between cardinal utility and ordinal utility. [3]
(c) Explain how equilibrium price can be determined with the help of [6]
(i) Demand and supply schedule.
(ii) Demand and supply curves.
Answers:
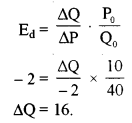
(a) Given P0 = ₹ 10
Q0 = 40
Ed = -2
∆P = – ₹ 2
Therefore, P1 = ₹ 8
We know,
According to the law of demand, quantity demanded falls with a rise in price and vice-versa, ceteris paribus.
Q1 = Q0 + ∆Q = 40 + 16 = 56 units.
Quantity demanded at the new price is 56 units.
(b) Two differences between cardinal and ordinal utility approach:
(i) Cardinal theory expresses utility in quantitative terms as according to this theory, utility is measurable. While the ordinal theory is of the view that utility at best can be ranked or ordered according to preference scales and is thus a qualitative approach.
(ii) Cardinal theory assumes that the marginal utility of money is constant (same whatever is the money income of the consumer). In ordinal theory, it is not necessary to assume constant marginal utility of money.
(ii) Cardinal theory explains price effect only through the substitution effect, ignoring income effect by assuming marginal utility of money to be constant whereas, ordinal theory divides price effect into substitution effect and income effect.
(iv) Cardinal theory fails to explain the case for exceptional demand curves where the demand curve is positively sloped (given good is such an example). However, the ordinal theory is able to explain such demand curves with the help of income effect and the substitution effect.
(v) The assumption of independent utility given up in cardinal theory, it has completely ignored the relation of substitution and complementarity between commodities. This flow is not present in the ordinal theory approach.
(c) (i) A demand schedule is a tabular presentation of combinations of prices and different levels of quantities demanded at those prices while a supply schedule is a tabular presentation of combinations of prices and different levels of quantities supplied at those prices. The table below shows the demand schedule and supply schedule.
| Price (per unit) | Quantity Demanded | Quantity Supplied | Market Position |
| 500 | 30 | 57 | Excess supply |
| 400 | 40 | 50 | Excess supply |
| 300 | 45 | 45 | Equilibrium |
| 200 | 55 | 35 | Excess demand |
| 100 | 70 | 20 | Excess demand |
Other illustrations of such kind are also possible.
Market demand is inversely related to price while market supply is directly related to price. The schedules combined together shows the operation of the law of demand and law of supply.
The equilibrium price is the price at which the consumers are willing to purchase the same quantity which the producers are willing to sell. In the given illustration, at price 500, there is excess supply (by the amount 27 units). As we move down the schedule, we find, at price 200 and below, we have excess demand (by the amount 20 units and 50 units). At price 300, quantity demanded equals quantity supplied and hence, it is the equilibrium price.
When the market is not in equilibrium (say at price 500), producers sell the commodity at a lower price so as to attract buyers, when there is excess supply and hence the market moves towards equilibrium. Similarly, in case of excess demand (say at price 100), the buyers compete against each other for the limited product, leading to a rise in prices. Thus, when the market is in disequilibrium, the actual market price will tend to move and reach equilibrium.
(ii) A demand curve is the graphical presentation of the demand schedule showing various price quantity combinations. While the supply curve is the graphical presentation of the supply schedule. The following diagram combines the market demand crave and the market supply curve.
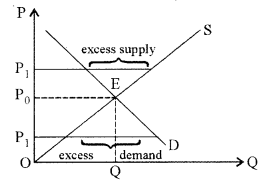
The equilibrium point is E where the demand curve intersects the supply curve, corresponding to which is the equilibrium price (here P0).
An excess supply (higher price) reduces price, thus moving towards equilibrium while an excess demand (lower price) leads to a rise in price. Finally, the market always attains equilibrium.
Question 4.
(a) Classify the following into fixed cost and variable cost giving a reason for your answer:
(i) Expenses incurred on raw material
(ii) Interest on capital
(iii) Salaries to permanent employees [3]
(b) Draw the TR and AR curves under perfect competition, with the help of a schedule. [3]
(c) Discuss four differences between perfect competition and monopolistic competition. [6]
Answers:
(a) (i) Variable cost: It is incurred only when there is production.
(ii) Fixed cost: It is incurred on fixed factor capital (in the short run) and remains constant when there is no production.
(iii) Fixed cost: It is payable even when there is no production.
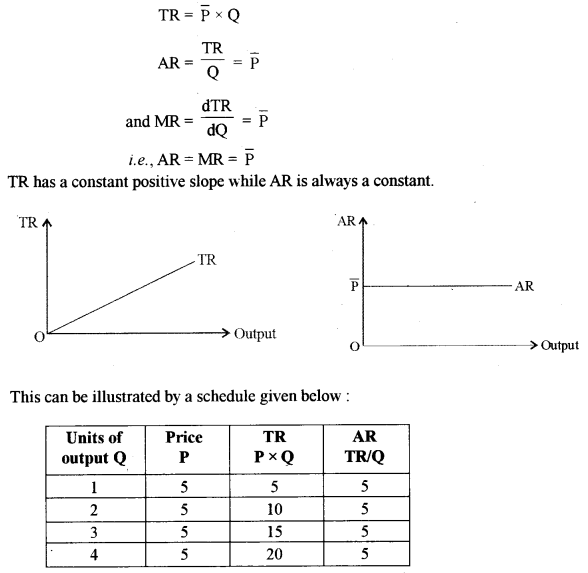
(b) The total revenue (TR) curve, changes in direct proportion to output as the price is constant under perfect competition.
We know,
(c)
| Perfect Competition | Monopolistic Competition |
| (i) Large number of sellers. | (i) Fairly large number of sellers. |
| (ii) The product is homogenous in nature. | (ii) The product is heterogeneous (differentiated) in nature. |
| (iii) The buyers have perfect knowledge about the product. | (iii) The buyers have some knowledge about the product. |
| (iv) There is no market power. | (iv) There is slight market power. |
| (v) The sellers are a price taker. | (v) The sellers are price maker. |
| (vi) Selling and advertisement costs do not exist. | (vi) Selling and advertisement costs exist. |
| (vii) Here, firms earn only normal profits in the long run. | (vii) Here, the firms earn supernormal profits in the long run. |
Question 5.
(a) Differentiate between the fixed factor of production and variable factor of production. [3]
(b) Show with the help of a diagram, how a perfectly competitive firm earns supernormal profit in short-run equilibrium. [3]
(c) Explain with the help of a diagram, the relationship between total product and marginal product. [6]
Answers:
(a) The factor of production that cannot be changed with changes in the level of production during the short run, is called a fixed factor. However, the factors of production which changes with change in the level of production both during the short run and long run, are known as variable factors of production.
For instance, during the short run, the plant and machinery are regarded as a fixed factor while raw materials and labour are considered as variable factors.
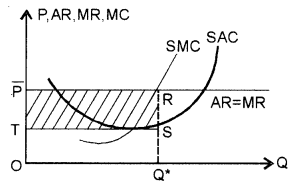
(b) The price is fixed at P in short-run (AR = MR). The MC passes through the minimum point of SAC curve and cuts MR at R. The firm decides its output at OQ*. Thus the total revenue TR is \(\overrightarrow{\mathrm{P}} \times \mathrm{Q}=\mathrm{O} \overline{\mathrm{P}} \mathrm{R} \mathrm{Q}^{*}\). The total cost (TC) for producing OQ* output = OTSQ*. Thus, the supernormal profit = TR – TC
\(\begin{array}{l}{=\mathrm{O} \overline{\mathrm{P}} \mathrm{RQ}^{*}-\mathrm{OTSQ}^{*}} \\ {=\overline{\mathrm{P}} \mathrm{RTS}}\end{array}\)
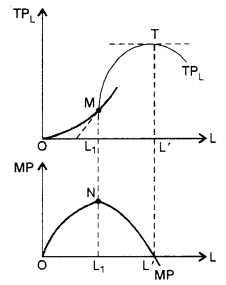
(c) The TP curve increases initially, at an increasing rate (till point M) and then at a decreasing rate, reaches a maximum at T and then falls.
When the TP increases at an increasing rate, the marginal product increases. However, when TP increases at a decreasing rate, MP declines. When TP is maximum, MP is zero and becomes negative when TP begins to decline.
This is shown in the diagram.
Question 6.
(a) Explain the primary functions of money. [3]
(b) Explain the following functions of the Reserve Bank of India: [3]
(i) Banker to the government
(ii) Issue of currency notes
(c) Explain the mechanism of credit creation by commercial banks with the help of an example. [6]
Answer:
(a) (i) Medium of exchange: Most important function of money is as a medium of exchange to facilitate transactions. Without money, all transactions would have to be conducted by barter, which involves direct exchange of one good or service for another. Money effectively eliminates the double coincidence of wants problem by serving as a medium of exchange that is accepted in all transactions, by all parties, regardless of whether they desired each other’s goods and services. Use of money has separated the process of sale and purchase.
(ii) Measure of value: Money is the measure of value. It serves as a unit of measurement in terms of which the values of all goods and services are measured and expressed. Expressing the value of the commodity in terms of money is known as its price, which is nothing, but the rate of exchanging a commodity.
(b) (i) Banker to the government: The government maintains an account in the central bank (Reserve Bank of India), just as individuals have in commercial banks. All incomes of the government are deposited and expenses are incurred out of this account. Reserve Bank of India keeps track of all the inflows and outflows. The government also borrows from the central bank (RBI) when necessary.
(ii) Issue of currency notes: The Reserve Bank of India enjoys the monopoly to issue paper notes which are the legal tender and a part of the money supply. In order to prevent the misuse of this power, the RBI has to follow certain principles. It has to keep a certain amount of gold and foreign securities against the issue of notes.
(c) Process of credit creation: It is often said “Loans create deposits and deposits create loans.” The statement can be explained as:
We assume, a situation in an economy where one bank ‘A’ receives a primary cash deposit from a person. After maintaining the Cash Reserve Ratio (CRR) with the central bank, the bank is left with the deposit of say ₹ 1000. Assuming that the Statutory Liquidity Ratio (SLR) is 10% of bank deposits, kept reserved for daily transactions, withdrawal etc. So the loanable fund with bank A becomes ₹ 1000 – ₹ 100 = ₹ 900.
A second person now comes to bank A with a loan requirement. The maximum amount of loan can be ₹ 900. However, bank A instead of providing cash loans will ask the person to open an account with the bank and provide him with the facility of drawing checks to the amount of ₹ 900. The second person after taking the loan, hands over the cheque to a third person who deposits the cheque in his own bank B. Thus a loan of ₹ 900 creates a derivative, deposit of the same amount in bank ‘B’, bank ‘B’ can in-turn lend to a third person a maximum of ₹ 810 (₹ 900 – ₹ 90). In this way in the subsequent stages, the derived deposits in the other banks reduce and the total volume of credit expands. The process continues until the loanable amount becomes negligible. Given SLR, mathematically the commercial banks jointly create a total volume of credit a multiple of the reciprocal of SLR, i.e.,
Volume of total credit = Primary deposit × \(\frac { 1 }{ SLR }\)
\(\frac { 1 }{ SLR }\) is known as the credit multiplier.
Alternatively, total v olume of credit creations = 1000 + 900 + 810 + 729 + …….
This is an infinite GP series = \(\frac { 1000 }{ 1-0.9 }\) = 10,000
Here, the whole banking sector is to be taken into account and good banking habits are to be inculcated among the citizens.
Question 7.
(a) Public expenditure helps in increasing the production of an economy. In this context, discuss any two points of importance of public expenditure. [3]
(b) Explain any two causes of disequilibrium in the balance of payment. [3]
(c) Define fiscal deficit, primary deficit and revenue deficit. Discuss their implications with reference to India. [6]
Answers:
(a) Importance of Public Expenditure on Production of an Economy:
(i) It helps in creating income for various individuals and firms as a result of the purchase of goods and services and factor services from them. Expenditure on defence, development activities etc. creates demand for various goods and services, creating income for those individuals and firms producing them, thus increasing the purchasing power of the people.
(ii) It can help in increasing the production by increasing the efficiency of the people (by spending on education, medical facilities, sanitation etc.).
(iii) It can be used to create human skills through education and training thus increasing the ability to work and produce more.
(iv) It can be used as a means of producing essential raw materials and important inputs in the public sector, thus removing various shortages and ensuring smooth production.
(v) It is helpful in promoting and developing the basic and key industries such as capital goods industries.
(vi) Public expenditure incurred in providing social security schemes increases the purchasing power of low-income groups and hence their ability to work, thus increasing their willingness to work because of secured future assured by these policies.
(b) Causes of Disequilibrium in the Balance of Payment (BOP):
(i) Fall in foreign demand: BOP deficit may arise due to a shift in foreign demand away from domestic goods to foreign products because of changes in preference or lower prices of foreign products. This leads to decreases in exports making the BOP unfavourable.
(ii) Inflationary pressure in the economy: A high rate of inflation at home encourages imports by making it relatively cheaper leading to decrease in the country’s competitiveness in the world market and reduces exports.
(iii) Developmental expenditure: Developing countries are poor. Hence they have to depend upon the developed nations for the supply of machines, technology etc. However, they cannot step up their exports to finance the increased imports, leading to a deficit.
(iv) Increase in the cost structure of export industries: It reduces the volume of exports by reducing the competitiveness of these industries in the world market (it may arise due to higher wages, higher prices of raw materials or inflation). Fall in exports makes the BOP unfavourable.
(v) The decrease in supply: A fall in supply at home say agricultural production due to crop failure say, or labour strike, shortage of raw materials etc. leads to fall in exports and imports may increase to overcome the scarcity resulting an adverse BOP.
(vi) Appreciation in the exchange rate: Appreciation increases the external value of a currency, making imports cheaper and exports dearer, leading to an adverse BOP.
(vii) Increase debt burden: Developing countries import capital largely in the form of portfolio investment, creating a large debt burden. Hence these countries are required to make large payments to the developed countries.
(viii) Demonstration effect: People of underdeveloped countries try to imitate the consumption pattern of developed countries regarding luxuries, leading to an increase in imports and hence a deficit.
(ix) Population pressure: A rapid increase in population in underdeveloped countries increase the demand for consumer goods. Hence exports surplus has fallen resulting in an adverse effect on the BOP.
(x) Political factors: They are also responsible for making BOP unfavourable. Political turmoil and instability in a number of countries-gulf countries, African countries, Afghanistan etc. have an adverse effect on their BOP.
(c) Fiscal deficit is the difference between the total expenditure and the sum of revenue and’ capital receipts excluding borrowings. Thus,
Fiscal deficit = Total budgetary expenditure – Revenue Receipts – Capital Receipts (excluding borrowings)
Implication: It has serious implication for the economy. Government has to borrow to meet this deficit, increasing future liability in the form of interest payment and repayment of loans. Payment of interest increases revenue expenditure, increasing the revenue deficit and thus leading to more borrowings and more interest payments. Hence, it is important to reduce the fiscal deficit for avoiding ‘debt trap’ and smooth functioning of the economy.
Primary deficit refers to the difference between fiscal deficit and interest payments.
Thus, Primary deficit = Fiscal deficit – Interest payments.
Implication: It indicates the real position of the government finances as it excludes the interest burden in respect of loans taken in the past, showing how much the government is borrowing to meets its expenses other than interest payments. It is a measure of the fiscal discipline of the government.
Revenue deficit denotes the difference between the revenue receipts and revenue expenditure. Thus,
Revenue deficit = Revenue Expenditure – Revenue Receipts.
Implication: It indicates the government’s current financial status. In India, the deficit on revenue account is very high. Revenue deficit means dissaving on government account which imposes a burden on the future generations because they have to bear the pinch of the interest burden.
Question 8.
(a) Show the relationship between APC and APS. [3]
(b) Explain the difference between induced investment and autonomous investment. [3]
(c) Discuss the main components of aggregate demand in an economy with the help of a diagram. [6]
Answers:
(a) Since income is either consumed or saved, i.e.,
or \(\frac{\mathrm{C}}{\mathrm{Y}}+\frac{\mathrm{S}}{\mathrm{Y}}=\frac{\mathrm{Y}}{\mathrm{Y}}\)
or APC + APS = 1
i.e., the sum is always unity at all levels of income.
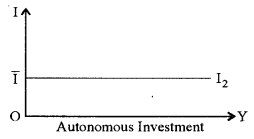
(b) 1. Induced investment is that investment which is undertaken as a result of a change in the level of income whereas Autonomous investment is that type of investment which is not affected by a change in the level of income or output.
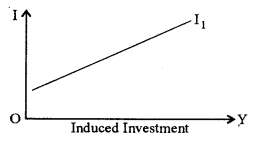
2. Induced investment varies directly with a change in income level while autonomous investment is income inelastic.
3. The induced investment shows a positive functional relationship between income and investment Autonomous investment is a horizontal line, parallel to the income axis, indicating some investment at all income levels.
(c) Aggregate demand is generated out of ‘planned’ or ‘desired’ aggregate expenditure in an economy during a particular year. Following are the main components of aggregate demand (AD) in an economy:
(i) Aggregate private consumption expenditure (C): This expenditure creates demand for various consumer goods and services in an economy.
(ii) Aggregate private investment expenditure (I): This expenditure creates demand for various investment goods in an economy.
(iii) Government expenditure (G): The government expenditure in a welfare state creates demand for consumption and investment goods in the economy.
(iv) Net exports (the difference between exports and imports) (X-M): Export income of a country during a particular year denotes the foreign demand for goods and services provided by the domestic country while import payments imply the demand for foreign goods during any particular year.
AD = C + I + G + (X – M)
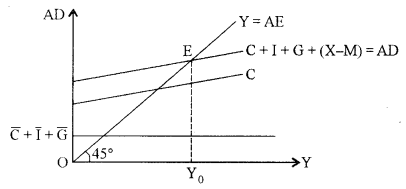
Here investment is considered autonomous and consumption expenditure consists of two parts – autonomous (\(\overline{\mathrm{C}}\)) and induced (bC, where b = MPC).
Question 9.
(a) Explain the following components of domestic factor income: [3]
(i) Compensation of employees
(ii) Operating surplus
(b) Distinguish between private income and personal income. [3]
(c) From the following data, calculate GNPMP and National Income by using the value-added method: [6]
| (i) The gross value of output in the primary sector (at FC) | 950 crores |
| (ii) Gross value of output in the secondary sector (at FC) | 470 crores |
| (iii) Gross value of output in the tertiary sector (at FC) | 500 crores |
| (iv) Value of intermediate goods in the primary sector | 360 crores |
| (v) Value of intermediate goods in the secondary sector | 200 crores |
| (vi) Value of intermediate goods in the tertiary sector | 175 crores |
| (vii) Depreciation | 20 crores |
| (viii) Indirect tax | 35 crores |
| (ix) Subsidy | 10 crores |
| (x) Net factor income from abroad | 4 crores |
Answers:
(a) (i) Compensation of employees: It is defined as all payments made by producers to their employees in the form of wages and salaries and other payments made in cash and kind and social security benefits in return for labour services. Labour income includes wages and salaries, supplementary labour income and payment in kind.
(ii) Operating surplus: It is the income earned from the ownership and control of capital and is also known as income from property and entrepreneurship. Capital income includes interest, rent, profits, royalties, dividends and other similar incomes.
(b) Private Income = National Income – Income from property and entrepreneurship accruing to the government commercial enterprises and administrative departments – Saving of non-departmental enterprises of the government + Interest on National Debt + Net current transfers from government + Net current transfers from abroad.
Personal Income = Private Income – Undistributed Profits – Corporate Profits Tax – Retained Foreign Earnings
(c) Given:
GVO primary (FC) = 950
GVO secondary (FC) = 470
GVO tertiary (FC) = 500
Value of intermediate goods in primary sector = 360
Value of intermediate goods in secondary sector = 200
Value of intermediate goods in tertiary sector = 175
Depreciation = 20 Indirect tax = 35 Subsidy = 10 NFIA = 4
GVAFC = Gross value of output in each sector – Intermediate product in each sector
= (950 – 360) + (470 – 200) + (500 – 175)
= ₹ 1185 crore
GNPMP = GVAFC + Indirect tax – Subsidy + NFIA
= 1185 + 35 – 10 + 4
= ₹ 1214 crore
National Income (NNPFC) = GVAFC – Depreciation + NFIA
= 1185-20 + 4
= ₹ 1169 crore
