ISC Economics Previous Year Question Paper 2014 Solved for Class 12
Maximum Marks: 80
Time allowed: 3 hours
- Candidates are allowed additional 15 minutes for only reading the paper.
- They must NOT start writing during this time.
- Answer Question 1 (Compulsory) from Part I and five questions from Part II.
- The intended marks for questions or parts of questions are given in brackets [ ].
Part – I (20 Marks)
Answer all questions.
Question 1.
Answer briefly each of the following questions (i) to (x).
(i) State the components of compensation of employees.
(ii) Explain the shape of the Average Cost Curve.
(iii) Explain the demand curve for a necessary commodity.
(iv) Explain any two causes of disequilibrium in the balance of payment in an economy.
(v) What is meant by high powered money?
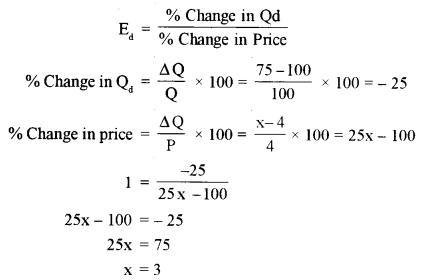
(vi) The demand for a commodity at 4 per unit is 100 units. The price of the commodity rises and as a result, its demand falls to 75 units. Find the new price if the price elasticity of demand for that commodity is I.
(vii) Justify the following as price-takers/price-makers:
(a) An oligopoly market.
(b) A perfectly competitive e-market.
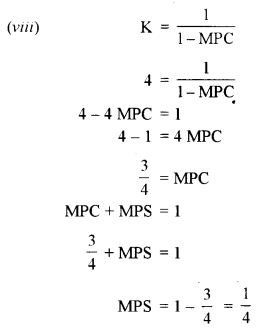
(viii) If the value of the multiplier is 4, what will be the value of MPC and MPS?
(ix) Distinguish between intended supply and actual supply.
(x) What is meant by deficit financing?
Answer:
(i) It includes all payments and benefits made by employers to their employees both in cash and kind in lieu of their production services. It is also known as income from work. It includes:
- Wages and salaries paid in cash or kind.
- Employer’s contribution to social security schemes.
- Payment of pension to retired persons.
(ii) AC curve is ‘U’ shaped because:
(a) In the initial stage, because of the increasing returns to a factor, MP tends to rise and (its inverse) MC tends to fall. Falling MC causes fall in AC as well.
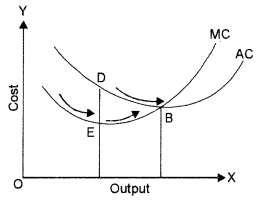
(b) When there is a constant return to a factor this will imply a situation of constant MP and constant MC. Because of stable MC, AC also tends to stabilise.
(c) When there are diminishing returns to a factor MP starts declining (and its inverse) MC starts rising. Rising MC causes AC to rise. In brief, AC assumes its ‘U’ shape in accordance with the law of variable proportions.
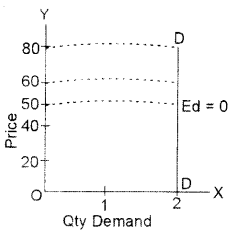
(iii) Demand Curve for a Necessity good:
It is a perfectly inelastic demand curve. When quantity demanded does not change at all in response to change in price of the commodity, demand for that commodity is said to be perfectly inelastic. The Demand curve is a straight line parallel to Y-axis.
(iv) (a) The imbalance between exports and imports because of large scale development expenditure which causes large imports, high domestic prices which leads to imports and cyclical fluctuations like recession or depression.
(b) Political instability and disturbances cause large capital outflows and hinder inflows of foreign capital.
(v) High powered money: It refers to the money produced by RBI and Government of India. The total liability of monetary authority of the Country and RBI is called High Powered Money (H) or monetary base. It consists of (a) currency (notes and coins) in the hands of the public (C), (b) Cash reserves of commercial bank (R), (c) Other deposits of RBI (OD).
Symbolically: H = C + R + OD
(vi) Q = 100, P1 = X
P = 4, Q1 = 75
Ed = 1
(vii) (a) An oligopoly market-Price maker.
Justification: An oligopoly is a market structure dominated by the small number of large firms and several of these firms are large enough to influence the market price, hence they are Price Maker.
(b) A perfectly competitive market-Price taker.
Justification: Every firm in perfect competition is very small compared to the overall size of the market. Only those firms which can cover their cost can survive. The market price will allow only for normal profits, which means that the individual firms cannot lower its prices to attract the customers. The individual firms also cannot raise their prices, because it will lose its customers to the competition. With each firm selling identical products, there is no customer loyalty. The customers will migrate to firms with lower price. Hence, all the firms in a perfectly competitive market are a price taker.
(ix)
| Intended Saving | Actual Saving |
| (a) The saving which is intended (planned) to be made by all the household in an economy during a period or at the beginning of the period is called intended (planned ) saving. | (a) It is the actual amount of saving that took place measured after the fact. |
| (b) It is also called ex-ante saving. | (b) It is also called ex-post saving. |
| (c) The amount of intended (planned) saving is given by saving function. | (c) Realised saving of a period (say, a year) is called actual saving. |
(x) Deficit financing: When a government spends more than what it currently receives in the form of taxes and fees during a fiscal year, it runs into a deficit budget. When the budget deficit is financed by borrowing from the public and banks, it is called deficit financing.
Part – II
(Answer any five questions)
Question 2.
(a) Study the diagram given below and answer the questions that Y follow:
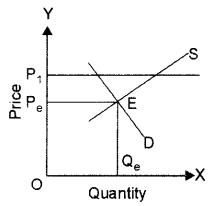
(i) Pe is the equilibrium price. What would prompt the government to fix the price at P1?
(ii) What would be the effect of fixing the price at P1?
(b) Discuss the effect of elasticity of demand on:
(i) a commodity which has many substitutes.
(ii) a small part of the individual’s income spent on a commodity.
(c) (i) Study the schedule given below and identify how much of commodity A and commodity B will a utility-maximizing consumer buy:
| Units of A | M.U. of A | Units of B | M.U. of B |
| 1 | 10 | 1 | 30 |
| 2 | 8 | 2 | 24 |
| 3 | 6 | 3 | 20 |
| 4 | 4 | 4 | 16 |
| 5 | 2 | 5 | 14 |
| 6 | 1 | 6 | 8 |
(ii) Explain the Law of Equi Marginal Utility, using the above schedule.
Answer:
(a) (i) P1 is the price floor. Price floor refers to the minimum price (above the equilibrium price)
fixed by the government, which the producer must be paid for their produce.
When the government feels that the price fixed by the forces of demand and supply is not remunerative from the producer ‘s point of view, then it fixes a price (known as price floor) which is more than the equilibrium price.
Most well-known examples of imposition of price floor are agricultural price support programmes and minimum wage legislation.
(ii) This will lead to a situation of excess supply.
(b) (i) Demand for a commodity with a large number of substitutes will be more elastic. The reason is that even a small rise in its prices will induce the buyers to buy the substitute.
(ii) The proportion of income spent: Proportion of consumer’s income that is spent on a particular commodity also influences the elasticity of demand for it. Greater the proportion of income spent on the commodity, more is the elasticity of demand for it and vice-versa. Demand for goods like salt, needle, soap, matchbox, etc. tends to be inelastic as consumers spend a small proportion of their income off such goods. When prices of such goods change, consumers continue to purchase almost the same quantity of these goods. However, if the proportion of income spent on a commodity is large, then demand for such a commodity will be elastic.
(c) (i) The consumer will buy 2 units of A and 4 units of B. The marginal utility derived from A and B are equal, therefore this is called the law of equi-marginal utility.
(ii) Law of Equi-marginal utility: This law states that the consumer maximizing his total utility will allocate his income among various commodities in such a way that his marginal utility of the last rupee spent on each commodity’ is equal.
Explanation of the law when the prices of different commodities are unequal:
In reality, we find that the prices of different commodities the consumer wants to purchase are unequal or indifferent.
| Units of A | M.U. of A | Units of B | M.U. of B |
| 1 | 10 | 1 | 30 |
| 2 | 8 | 2 | 24 |
| 3 | 6 | 3 | 20 |
| 4 | 4 | 4 | 16 |
| 5 | 2 | 5 | 14 |
| 6 | 1 | 6 | 8 |
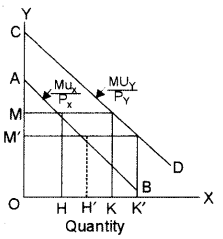
Since, marginal utility curves of goods slopes downwards, curves depicting MUx/Px and will also slope downward.
As the income of the consumer is given, let the marginal utility of money be constant at OM utils.
MUX/PX is equal to OM. when OH amount of good X is purchased. MUY/PY is equal to OM. w hen OK quantity of good Y is purchased. Thus, when the consumer is buying OH of X and OK of Y then MUX/PX = MUY/PY = MUM.
Therefore, the consumer is in equilibrium when he is buying OH of X and OK of Y. No other allocation of money expenditure will yield greater utility, when he is buying OH of X and OK of Y.
Question 3.
(a) Discuss how the supply of labour is an exception to the law of supply.
(b) According to the Law of Variable Proportions, in which stage would a producer like to operate? Explain why.
(c) Explain how a producer can attain equilibrium using TR and TC approach.
Answer:
(a) The rise in the price of a good or service sometimes its lead to falling in its supply. For eg. the supply of labour. A higher wage rate enables the worker to maintain his existing material standard of living with less work and he may prefer extra leisure to more wages. The supply curve in such a situation will be backward bending sloping SS1.
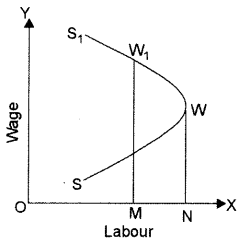
At WN wage rate, the supply of labour is ON. But beyond NW wage rate, the worker will reduce rather than increase his working hours. At MW1. wage rate the supply of labour is reduced to OM.
(b) The producer will like to operate in stage II where TP increases at a diminishing rate, MP falls but remains positive. In this phase. AP is maximum and MP is zero, TP rises at a diminishing rate.
(c) A firm attains the stage of equilibrium when it maximizes its profits i.e. when he maximizes. the difference between TR and TC. After reaching such a position, there will be no incentive for the producer to increase or decrease the output and the producer will be said to be at equilibrium.
According to TR – TC approach, producer’s equilibrium refers to a stage of that output level at which the difference between TR and TC is positively maximized and total profits fall as more units of output are produced. Two essential conditions of producer’s equilibrium are:
- The difference between TR and TC is positively maximized.
- Total profits fall after that level of output.
The first condition is an essential condition. But, it must be supplemented with the second condition. So, both the conditions are necessary to attain the producer’s equilibrium.
Producer’s equilibrium (when prices remain constant): When price remain same at all output levels, each producer aims to produce that level of output at which he can earn maximum profits, i.e., when the difference between TR and TC is maximum.
| Output (unit) | Price (₹) | TR (₹) | TC (₹) | TR – TC (profit |
| 0 | 10 | 0 | 5 | -5 |
| 1 | 10 | 10 | 8 | 2 |
| 2 | 10 | 20 | 15 | 5 |
| 3 | 10 | 30 | 21 | 9 |
| 4 | 10 | 40 | 31 | 9 |
| 5 | 10 | 50 | 42 | 8 |
| 6 | 10 | 60 | 54 | 6 |
According to the table, the maximum profit of ₹ 9 can be achieved by either producing 3 units or 4 units. But the producer will be at equilibrium at 4 units of output because at this level both the conditions of producer’s equilibrium are satisfied:
(i) A producer is earning a maximum profit of ₹ 9.
(ii) Total profit falls to ? 8 after 4 units of output.
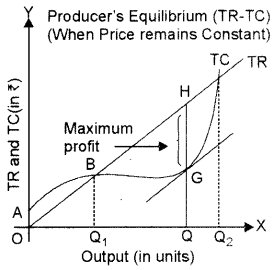
Producer’s equilibrium will be determined at the OQ level of output at which the vertical distance between TR and TC curves is the greatest. At this level of output, tangent to TC curve (at point G ) is parallel to the TR curve and the difference between y both the curves (which is shown by GH) is £ maximum.
At quantities smaller or larger than OQ, such as OQ1 and OQ2 units, the tangent to the TC curve A would not be parallel to TR curve. So the q producer will be at equilibrium at OQ units of output.
Producer’s equilibrium (when Price falls with a rise in the level of output)
When the price falls with rise in the level of output, each producer aims to produce at that level of output where he can earn maximum profits i.e., the difference between TR and TC is the maximum.
| Output (unit) | Price (₹) | TR (₹) | TC (₹) | TR – TC (profit remarks) |
| 0 | 10 | 0 | 2 | -2 |
| 1 | 9 | 9 | 5 | 4 |
| 2 | 8 | 16 | 9 | 7 |
| 3 | 7 | 21 | 11 | 10 |
| 4 | 6 | 24 | 14 | 10 |
| 5 | 5 | 25 | 20 | 5 |
| 6 | 4 | 24 | 27 | -3 |
The producer will be at equilibrium at 4 units of output because, at this level, both the conditions. of producer s equilibrium are satisfied.
A producer is earning maximum profit at ₹ 10. Total profits fall to ₹ 5, after 4 units of output. Producer’s equilibrium will be determined at the OQ level of output at which the vertical distance between the TR and TC curve is greatest. At this level of output, tangent to TR curve (at point H) is parallel to a tangent to TC curve ( at point G ) and the difference between both the curves (shown by GH) is maximum.
Question 4.
(a) Explain the relationship between AC and MC with the help of a diagram.
(b) Highlight any three differences between monopolistic competition and oligopoly.
(c) A perfectly competitive firm can continue producing even if it is incurring losses in short-run equilibrium. Justify the given statement with the help of a diagram.
Answer:
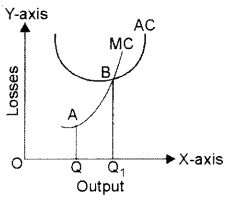
(a) (i) When MC is less than AC, AC falls with an increase in output. i.e. till 3 units of output.
(ii) When MC ¡s equal to AC, i.e., when MC and AC curves intersect each other at point A, AC is constant and it’s a minimum point.
(iii) When MC is more than AC, AC rises with an increase in output, i.e., from 5 units of output.
(iv) Thereafter, both AC and MC rise, but MC increases at a faster rate as compared to AC. As a result, the MC curve is curved.
(b)
| Monopolistic Competition | Oligopoly Competition |
| It is a market structure containing a large number of relatively small firms. | It is a market structure containing the small number of relatively large firms. |
| There are free entry and exit of other firms. | The entry is not free. |
| A demand curve is downward sloping. | The exact behaviour of the demand curve is difficult to predict. |
(c) Shut Down Point: Simple question is why firms continue producing the product if they are making losses. In the short run, the firms cannot go out of the industry by disposing of the plant. Why do they not down? It is because they cannot change the fixed factors and they have to face fixed costs even if the firm is shut down. The firm can avoid only variable costs but it has to bear the fixed costs whether to produce or not. The firm will continue producing till the price covers the average variable cost. If the price covers some part of the o average fixed costs besides the variable cost, the producer will continue producing. Thus the firm will continue producing so long as price exceeds the average variable cost. The shutdown point can be shown with the help of a diagram:
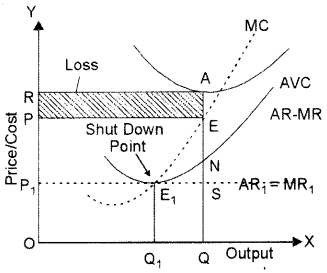
In the diagram, equilibrium is at E where MR = MC and MC cuts MR from below. The price is EQ and OQ is the output. This price covers the average variable cost and some portion of AFC M NE but still per unit loss is AE but the form will continue production as if it stops production loss per unit will form AN i.e. difference between AC & AVC/.e, AFC (AO – NQ = AN). If the market price falls to OP1 only AVC is covered i.e. E1Q1 = OP1, Now there will not be any use to continue production and so E1 will be shut down point.
Question 5.
(a) Differentiate with the help of diagrams, contraction in supply and decrease in supply.
(b) Identify the market where a firm is not required to reduce the price to sell more. Explain the behaviour or TR and MR.
(c) Explain how a consumer attains equilibrium using the indifference curve analysis.
Answer:
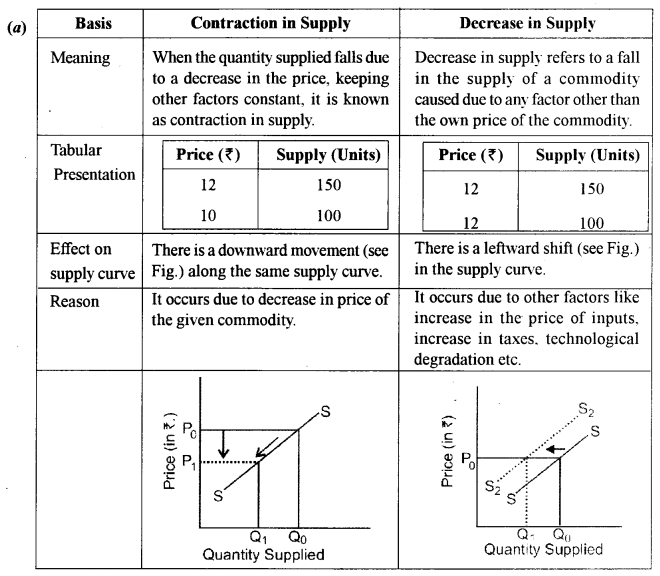
(b) The market where the firm is not required to reduce the price to sell more is “perfect competition” because under perfect competition, price is fixed and it is same for every firm. Relationship between TR and MR (When price remains constant)
When price remains constant, firms can sell any quantity of output at the price fixed by the market. As a result, the MR curve (and AR curve) is a horizontal straight line parallel to the X-axis. Since MR remains constant, TR also increases at a constant rate (see table). Due to this reason, the TR curve is a positively sloped straight line (see fig.) As TR is zero at zero levels of output, the TR curve starts from the origin.
Table: TR and MR (When price remain constant)

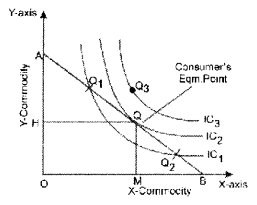
(c) A consumer shall be in equilibrium where he can maximise his satisfaction, subject to his budget constraints. It refers to a situation in which a consumer with his given income and given prices, purchases such a combination of goods which gives him maximum satisfaction and he does not want to bring any change in it.
Conditions of Consumer’s Equilibrium:
According to indifference curve approach, a consumer will be in equilibrium. when the following two conditions are satisfied:
(i) Budget line or Price line should be tangent to indifference curve i.e.,
MRSXY = or Slope of IC = Slope of PL
(ii) Indifference curve should be convex to the point of origin at equilibrium point or we can say MRS is declining.
The point where these two conditions are fulfilled simultaneously represents eqm. for the consumer because that relates to the highest indifference curve that consumer can reach within his available budget. It can be shown with the help of the following diagram: It is clear from the figure that ‘Q’ is the only eqm. point where both the conditions of eqm. are fulfilled. Where the consumer buys ‘OM’ of X Commodity and ‘OH’ of Y Commodity. Any other point-like and Q2 cannot be considered as an optimum point because they lie on a lower indifference curve IC. Any point lying on IC3 like ‘Q3’ is beyond the reach of the consumer and no eqm. condition is satisfied.
Thus on Price line AB, ‘Q’ is on the highest IC, that gives maximum satisfaction to the consumer. At point ‘Q’ both the conditions of eqm. are satisfied.
Question 6.
(a) Discuss two contingent functions of money.
(b) Explain the role of the Reserve Bank of India with respect to:
(i) Custodian of foreign exchange.
(ii) Promotional and developmental functions.
(c) Discuss how the exchange rate is determined under a flexible exchange rate system.
Answer:
(a) Facilitates Credit: Money facilitates the functioning of credit instruments such as cheques, promissory notes, bills of exchange, etc. Such credit instruments facilitate the transfer of value from one person to another.
Liquidity: Money is the most liquid form of all the assets and wealth. Gold, silver, land, cheques are not as liquid as money. If the need arises, then these assets need to be converted into money, but on the other hand, money need not be converted into any other form as it is readily acceptable. Apart from being liquid, money also provides a guarantee of liquidity/solvency to other forms of wealth and assets. This implies that money can be converted into any type of asset and on another hand, any type of asset can be converted into money.
(b) (i) Reserve Bank keeps a close watch on the external value of its currency and undertakes exchange management control. All the foreign currency received by the citizens has to be deposited with the reserve bank and if citizens want to make payment in foreign currency, they have to apply to reserve bank. It also keeps gold and billion reserves.
(ii) Promotional and developmental functions: The RBI has been a promoter since its inception. Various promotional and developmental functions of RBI are:
- By encouraging commercial banks to expand their branches in semi-urban and rural areas, the reserve bank helps:
To reduce the dependence of the people in these areas on the defective unorganized sector of indigenous bankers and money lenders. To develop the banking habits of the people. - By establishing the Deposit Insurance Corporations.
- Through the Institutions like Unit Trust of India, the Reserve Bank helps to mobilize saving in the country.
- Since its inception, Reserve Bank is making efforts to promote institutional agricultural credit by developing cooperative credit institutions.
- It also helps to promote the process of industrialization in the country by setting up specialized institutions for industrial finance.
- It also takes measures for developing the bill market in the country.
(c) The flexible exchange rate is determined by the interaction of the forces of demand and supply.
The equilibrium exchange rate is determined at a level where the demand for foreign exchange is equal to the supply of foreign exchange. This will be clear from As seen in the diagram, demand and supply of foreign exchange are measured on the X-axis whereas the rate of foreign exchange on the Y-axis. DD is the downward sloping demand curve of foreign exchange and SS is the upward-sloping supply curve of foreign exchange. Both the curves intersect each other at point ‘E The equilibrium exchange rate is determined at OR and the equilibrium quantity is determined at OQ.
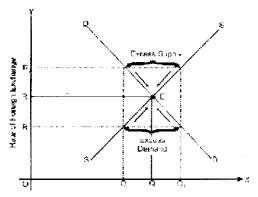
Any exchange rate (other than OR) is not the Equilibrium Exchange Rate
(i) If the exchange rate is more than equilibrium rate.
If the exchange rate rises to OR2, then demand for foreign exchange will fall to OQ2 and supply will rise to OQ1. It will be a situation of excess supply. As a result, the exchange rate will fall till it again reaches the equilibrium level of OR.
(ii) If the exchange rate is less than the equilibrium rate.
If the exchange rate falls to OR1, then demand will rise to OQ1 and supply will fall to OQ2. It will be a case of excess demand. It will push up the exchange rate until it reaches OR.
Question 7.
(a) Explain how public expenditure can be used as a tool to attain economic stability.
(b) Differentiate between degressive taxation and regressive taxation.
(c) Explain the various components of the budget.
Answer:
(a) Public expenditure helps to attain economic stability in following ways:
Production and Employment:
It depends on:
The capability of the people to work, save and invest.
The will of the people to work, save and invest.
Transfer the resources to different uses and regions.
Government Expenditure and Economic Stability: The activities of the market economy are never alike. Sometimes, there is brisk in economic life while on other occasions, the business life faces sluggish behaviour. Thus after 1930‘s Great Depression, the economist is stressing upon economic stabilization. According to Keynes, economic crisis rose because AD was less than AS and lower MPC along with lower MEC played their role. Therefore, he stressed upon increasing consumption and investment for the sake of economic stability.
Public Expenditure and Economic Growth: The public expenditure can be used to remove unequal income distribution. The facilities of health, education and communication can be made available. All such means that government expenditure can be used for economic growth and development. Moreover, because of government expenditure, the incomes of the people through the multiplier process will increase. When income will increase, the saving will also increase, which can be used for investment. This shows that an increase in government expenditure can play a vital role in the economic growth of the country.
(b)
| Degressive Taxation | Regressive Taxation |
| It is a type of tax in which people with high incomes pay less tax as a percentage of their income than those people with low income. | It is a tax imposed in such a manner that the tax rate decreases as the number of taxation increases. |
| Those tax take place when a tax is just vaguely progressive. For e.g., when the speed of development is not sufficiently spiky. | In terms of individual income and wealth, a regressive tax imposes a greater burden on the poor than on the rich. |
| Those tax might take place when the uppermost proportion is laid down for that particular kind of revenue on which it is projected to put forth most weight, and from this position onwards, taxes are implied rationally on upper-income groups and decreasingly on lesser incomes, declining to zero on poorest income group. | These taxes tend to reduce the tax -incidence of people with higher ability to pay tax, as they shift the incidence disproportionately to those with lower ability to pay. |
(c) Components of Budget: The budget has two broad components
(1) Revenue budget
(2) Capital budget.
(1) Revenue budget includes revenue receipts and expenditure of the government.
(a) Revenue Receipts: It refers to those receipts of the government which neither create a liability nor leads to a reduction in assets.
Tax Revenue: It consists of the proceeds of taxes and other duties levied by the government.
Non Tax Revenue: It includes receipts from sources other than tax.
(b) Revenue Expenditure:
- It refers to all those expenditures of the government which do not result in the creation of physical assets.
- Capital Budget includes capital receipts and expenditure of the government.
- Capital Receipts: It is defined as any receipts of the government which either create liability or reduce assets.
- Capital Expenditure: An expenditure which either creates assets or reduce liabilities.
Question 8.
(a) Discuss the mechanism of investment multiplier with the help of a numerical example.
(b) Distinguish between marginal propensity to consume and marginal propensity to save. What is the relationship between the two?
(c) Explain the determination of the equilibrium level of output with the help of saving and investment curves. If savings exceed planned investment, what changes will bring about equality between them?
Answer:
(a) Increase in investment in an economy generates a multiplier effect on its national income. The extent of multiplier effect (and therefore, the extent of the total increase in income) depends on the marginal propensity to consume (MPC). Higher the MPC, greater would be the multiplier effect and vice-versa.
Illustration: Let us assume that Increase in investment = ₹ 100 crore
MPC = 0.90
\(\begin{array}{l}{\mathrm{K}=\frac{\Delta \mathrm{Y}}{\Delta \mathrm{I}}} \\ {\mathrm{K}=\frac{1}{1-\mathrm{MPC}}} \\ {\mathrm{K}=\frac{1}{1-0.90}=2}\end{array}\)
Putting value of K in equation (ii)
\(\begin{aligned} 10 &=\frac{\Delta Y}{100} \\ 1000 &=\Delta Y \end{aligned}\)
(b) APC can be > 1 in situation when C > Y
| Average Propensity to Consume (APC) | Marginal Propensity to Consume (MPC) |
| 1. It refers to the ratio of consumption expenditure (C) to the corresponding level of income (Y) at a point of time. APC = C/Y | 2. When income increases APC falls but at a rate less than that of MPC. |
| 1. It refers to the ratio of change in consumption expenditure (DC) to change in total income (DY) over a period of time. MPC = DC/DY | 2. When income increases, MPC falls but at a rate more than that of APC. |
(c) Saving-Investment Approach (S-1 Approach)
According to this approach, the equilibrium level of income is determined at a level, when planned saving (S) is equal to planned investment (I).
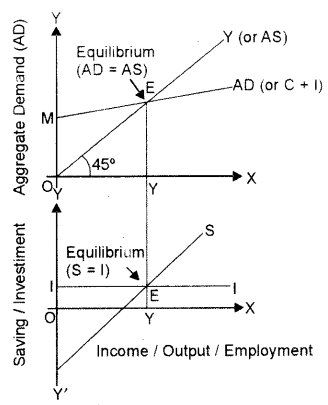
In Fig, Investment curve (I) is parallel to the X-axis because of the autonomous character of investments. The Saving curve (S) slopes upwards showing that as income rises; saving also rises.
The economy is in equilibrium at point ‘E’ where saving and investment curves, intersect each other.
At point ‘E\ ex-ante saving is equal to ex- ante investment.
OY is the equilibrium level of output corresponding to point E.
When Saving is more than Investment
If planned saving is more than planned investment, i.e., after point ‘E’ in Fig., it means that households are not consuming as much as the firms expected them to. As a result, the inventory rises above the desired level.
To clear the unwanted increase in inventory, firms would plan to reduce the production till saving and investment become equal to each other.
When Saving is less than Investment
If planned saving is less than planned investment, i.e. before point ‘E’ in Fig., it means that households are consuming more and saving less than what the firms expected them to. As a result, planned inventory would fall below the desired level.
To bring the inventory back to the desired level, firms would plan to increase the production until saving and investment become equal to each other.
Question 9.
(a) How can personal disposable income be derived from private income?
(b) Explain any three precautions which should be taken while estimating national income by income method.
(c) Calculate national income and operating surplus from the following data:
| (i) Government final consumption expenditure | 800 crores |
| (ii) Net factor income earned from abroad | -110 crores |
| (iii) Private final consumption expenditure | 900 crores |
| (iv) Net domestic capital formation | 200 crores |
| (v) Profits | 220 crores |
| (vi) Rent | 90 crores |
| (vii) Net exports | -25 crores |
| (viii) Interest | 100 crores |
| (ix) Net indirect taxes | 165 crores |
Answer:
(a) Personal disposable income is that part of personal income which is available to the households for disposal as like.
Personal Disposable Income – Personal Tax Payments – Non-tax Payments.
(b) (i) Only factor incomes which are earned by rendering productive services are included. All types of transfer income are excluded.
(ii) Sale and purchase of secondhand goods are excluded since they are not part of the production of the current year. Likewise, sale proceeds of shares and bonds are not included.
(iii) Imputed rent of owners occupied dwellings and value of production for self-consumption are included but the value of self-consumed services is not included.
(c) Operating surplus = Rent + Interest + Profit = 90 + 100 + 220 = 410
National Income = Government final consumption expenditure + Private final consumption expenditure + Net domestic capital formation + Net exports + Net factor income earned from abroad
National Income = 800 + 900 + 200 + (- 25) + (-110) = 1900+ (-135) = 1765
