ISC Economics Previous Year Question Paper 2012 Solved for Class 12
Maximum Marks: 80
Time allowed: 3 hours
- Candidates are allowed additional 15 minutes for only reading the paper.
- They must NOT start writing during this time.
- Answer Question 1 (Compulsory) from Part I and five questions from Part II.
- The intended marks for questions or parts of questions are given in brackets [ ].
Part – I (20 Marks)
Answer All Questions
Question 1.
Answer briefly each of the questions (i) to (xv).
(i) Name and explain the two main branches of economics.
(ii) State the law of equi marginal utility.
(iii) Explain with an example, what kind of a commodity will have an inverse relationship between income and demand.
(iv) Explain the meaning of indivisibility of a factor with an example.
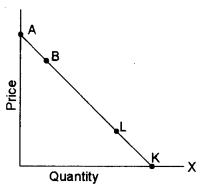
(v) What will be the price elasticity of demand of the points A, B, L and K in the diagram given below:
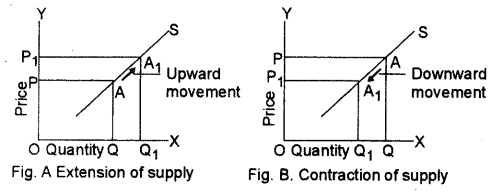
(vi) State what causes a movement along the supply curve and show it diagrammatically.
(vii) Define marginal cost. With the help of an example, show how marginal cost can be obtained from the total cost.
(viii) Give the modem definition of economic rent.
(ix) Which revenue concept is also called price? Justify your answer by giving a reason.
(x) Distinguish between national income at current prices and national income at constant prices.
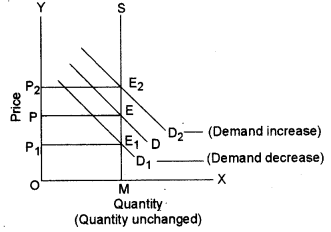
(xi) When does the equilibrium quantity in a market remain unchanged with a change in demand? Show it with the help of a diagram.
(xii) What is the significance of freedom of entry and exit of firms under perfect competition?
(xiii) Give one difference between a flexible exchange rate and a fixed exchange rate.
(xiv) What is meant by zero-base budget?
(xv) Explain two merits of direct tax.
Answer:
(ii) Law of Equi-marginal utility states that the consumer in order to maximize his satisfaction should spend his money on two goods in such a manner that the ratio of marginal utility of a commodity to its price becomes equal to the ratio of marginal utility of other commodities to its price. Symbolically,
MUx / Px = MUy/Py = MUn/Pn
(iii) Inferior goods have an inverse relationship between their demand and income. For example, the demand for an inferior good like maize may decrease when income increases beyond a particular level because the consumers may substitute it by a superior-good like wheat or rice.
(v) At point ‘A’, the elasticity of demand will be,
The lower segment of the line/upper segment of line = AK/0 = ∞
At point ‘B’ = BK/AB > 1 i.e. ed > 1
At point ‘L’ = LK /AK < 1 i.e. ed < 1
At point ‘K’ = 0/AK = 0 i.e. ed = 0
(vi) Movement along the supply curve is caused due to change in the price of the commodity keeping other factors constant. If the price of that commodity rises, its quantity supply will also rise causing upward movement along the supply curve (i.e. extension of supply) as shown in fig. A. On the other hand, if the price of the commodity falls showing downward movement along the supply curve (i.e. contraction of supply) indicated by downward arrow in fig.B.
(vii) Marginal cost (MC) is an addition made to the total cost (TC) when output is change by one unit i.e.,
MC = ΔTC/Q
MC = TCn – TCn-1
For example, the marginal cost of 4th unit is the changed in the total cost when output is increased from three units to four units (i.e. 192 – 162 = 30), as shown in the table given below.
| Output Units | TC (₹) | MC |
| 1 | 20 | |
| 2 | 30 | 30 – 20 = 10 |
| 3 | 50 | 50 – 30 = 20 |
| 4 | 80 | 80 – 50 = 30 |
(ix) Average revenue is revenue earned per unit of the product sold.
\(\mathrm{AR}=\frac{\mathrm{TR}}{\mathrm{Q}}\)
But TR = P × Q
\(\mathrm{AR}=\frac{\mathrm{P} \times \mathrm{Q}}{\mathrm{Q}}=\mathrm{P}\)
(x)
| National Income at Current Price (Nominal GDP) | National Price at Constant Price (Real GDP) |
| Under this GDP is calculated at current prices prevailing in the market for example if we measure India’s National Income of at 2011-12 at the same year’s prices than it is national income at the current price. | Under this GDP is calculated at a base year price. For example, if we measure India’s National income of 2009-10 at 2001-2002 prices than it is national income at a constant price. |
| This may give a misleading picture of the economic growth of a country because of an increase in National Income maybe because of the increase in price rather than any physical output goods and services. | On the other hand, this gives true picture of economic growth of a country as it is affected by the change in only the physical quantities. |
| National Income at current price = P1 × Q1 Where P1 = Current Price and Q1 = Current Quantity |
National Income at Constant Price = P0 × Q1 Where P0 = Base year Price and Q1 = Current Quantity |
(xi) The equilibrium quantity remains unchanged with a change in demand.
When supply curve is perfectly inelastic: When supply curve is perfectly inelastic, a change in demand (increase or decrease) brings about a change in equilibrium price, but the equilibrium quantity remains the same as illustrated in fig.
(xii) Freedom of entry and exit under perfect competition means that new firms are free to enter the industry and existing firms are free to leave the industry if they desire so. This condition ensures that all firms under Perfect competition end up earning only normal profits in the long run. The entry of new firms will increase the total supply by the industry, thus reducing the market price and wiping out supernormal profits. On the other hand, if existing firms are incurring losses, some of them would start leaving the industry, leading to a decrease in supply and a rise in price until the losses are wiped out.
(xiii) The fixed exchange rate is a rate that is fixed and determined by the government of a country and only the government can change it. It is independent of free-market forces of demand and supply. Whereas the flexible exchange rate is that rate which is determined by the demand and supply of different currencies in the foreign exchange market. The government does not intervene in the fixation of the exchange rate.
Part – II
(Answer Any Five Questions)
Question 2.
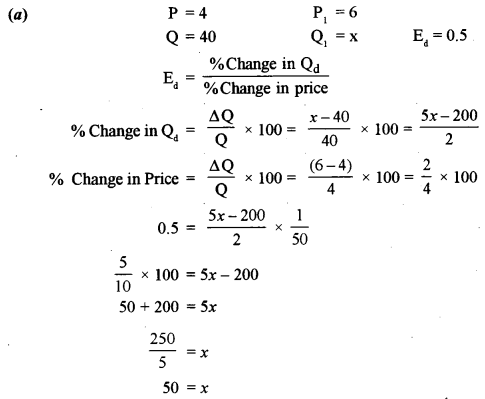
(a) Calculate the quantity demanded of a commodity when its price increases from ₹ 4 to ₹ 6. The original quantity demanded was 40 units and the price elasticity of demand is 0.5.
(b) Explain how the following phenomena are exceptions to the Law of Demand:
(i) Expectations regarding future prices.
(ii) Conspicuous consumption by a consumer.
(c) Discuss four factors other than price, that affect the demand of a commodity.
Answer:
(b) Expectations regarding future prices: If the price of a commodity is rising today and it is likely to rise more in the future, people will buy more even at the existing price and store it up. They will do this in order to avoid the pinch of higher prices in the future. Similarly, when large fall in the price of a commodity is anticipated, consumers will postpone their purchase even if the prices fall today so as to purchase this commodity at a still lower price in future.
Conspicuous consumption: The law of demand does not apply to status symbol commodities termed as Veblen. These goods are demanded more at higher prices by (rich) consumers to increase their social prestige or as a source of display of wealth or richness. For example, diamond.
(c) Four factors affecting demand are as follows:
Consumers tastes and Preferences: Tastes and preferences depend on social customs, fashion, habits of people etc. which keeps on changing leading to change in customers’ taste and preferences. As a result, the demand for different goods changes. For example, consumers may switch over from cheaper old fashioned goods to costlier ‘mod’ goods.
The income of the consumer: Generally when the income of a consumer goes up, the demand . for a commodity also goes up and when income falls, the demand also falls in case of normal goods.
Price of related goods (i.e. of substitute goods and complementary goods): In the case of complementary goods like car and petrol, the demand for a commodity rises with a fall in the price of complementary good. In the case of substitute goods like tea and coffee, demand for a commodity falls with a fall in the price of other substitutes good.
The expectation of Change in the Price in Future: If the price of a certain commodity is expected to increase in the near future, then people will buy more of that commodity than what they normally buy. There exists a direct relationship between the expectation of change in the prices in future and change in demand in the current period. For example, if the price of petrol is expected to rise in future, its present demand will increase.
Question 3.
(a) Define price elasticity of supply. Draw diagrams when price elasticity of supply is;
(i) Equal to one.
(ii) Greater than one.
(b) Differentiate between returns to variable factor and returns to scale.
(c) Explain with the help of a diagram, the relationship between total product and marginal product.
Answer:
(a) Price elasticity refers to the degree of responsiveness of quantity supplied of a commodity to change in its price. It is calculated as, es = % change in quantity supplied/ % change in the price of a commodity.
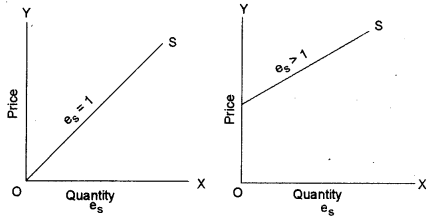
(b) Difference between returns to variable factor and returns to scale are as follows:
- The law of Returns to variable factor means the change in physical output when the quantity of one factor is changed, other inputs remain fixed. Returns to scale on the other hand means a change in the physical output when the quantity of all the factors is increased simultaneously at the same proportion.
- The law of variable factors studies the effect of change in one input on the output, whereas Returns to scale studies the effect of change in all inputs on the output.
- The law of variable proportion or Return to a factor is a short-run phenomenon whereas ‘the returns to scale’ is a long-run phenomenon.
- Returns to variable factor take account of the change in factor proportions whereas Returns to scale takes factor proportions to be unchanged.
(c) (i) When MP increases, TP increases at an increasing rate.
(ii) When MP is constant, TP increases at constant rate.
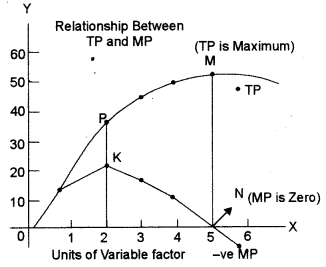
(iii) When MP decreases, TP increases at a diminishing rate
(iv) When MP is zero, TP is maximum.
(v) When MP is negative, TP declines.
Question 4.
(a) Explain diagrammatically how equilibrium price and equilibrium quantity are affected by changes in the demand for a commodity, with the supply remaining constant.
(b) Define the production function. Discuss two criticisms of the Law of Variable Proportions.
(c) How does a perfectly competitive firm earn supernormal profits in the short-run equilibrium? Explain it with the help of a diagram.
Answer:
(a) When demand increases:
An increase in demand is a situation under which demand curve shifts to the right due to other factors i.e., increase in the price of substitutes, decrease in price of complementary goods, increase in income (normal good) etc.
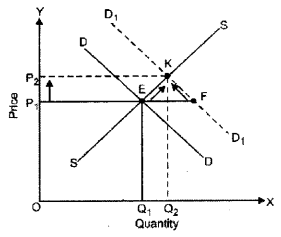
(i) DD is the initial demand curve, crossing the supply curve at point E, the point of initial equilibrium.
(ii) Due to increase in demand, demand curve shifts to the right, from DD to D1D1. And at the existing price (OP1), quantity demanded rises from point E to point F.
(iii) As an immediate impact of the increase in demand, there is excess demand in the market. It is EF (at the existing price).
(iv) Due to the pressure of demand, price of the commodity tends to be higher than the equilibrium price.
(v) Due to the rising price, quantity demanded tends to contract. Contraction of demand occurs from point F towards point K.
(vi) Due to the rising price, quantity supplied tends to extend. The extension of supply occurs from point E towards point K.
The process of extension of supply and contraction of demand continue till new equilibrium K is established, which is at a higher price and higher quantity demanded.
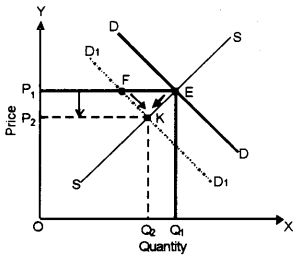
When demand decreases:
A decrease in demand is the situation when the demand curve shifts to the left due to other factors. i.e., decrease in the price of substitute increase in price of complementary goods, a decrease in income etc.
(i) DD is the initial demand curve, crossing the supply curve at point E, the point of initial equilibrium.
(ii) Due to a decrease in demand, demand curve shifts to the left, from DD to D1D1. At the existing price (OP1), quality demanded falls from point E to point F.
(iii) As an immediate impact of the decrease in demand, there is excess supply in the market. It is EF (at the existing price).
(iv) Due to excess supply price of the commodity tends to be lower than the equilibrium price.
(v) Due to lowering price, quantity demanded tends to extend. Extension of demand occurs from point F towards point K.
(vi) Due to lowering price, quantity supply tends to contract. The contraction of supply occurs from point E towards point K.
(vii) The process of extension of demand and contraction of supply continues till new equilibrium K is established which is at the lower price and lower quantity demanded.
(b) A production function shows the maximum quantity of a commodity that can be produced per unit of time with the given amount of inputs when the best production technique available is used.
Two criticism of law of variable proportion is:
Homogeneity of Variable factors: The assumption of homogeneous or equally efficient variable factors is criticized as it is not practical.
Unchanged technologies: Law of variable proportions assumes technology to be given and remain unchanged which makes it unrealistic.
(c) In short-run, a perfectly competitive firm can earn supernormal profits, normal profits and can sustain loss also. A perfectly competitive firm earning SNP is shown alongside in the diagram.
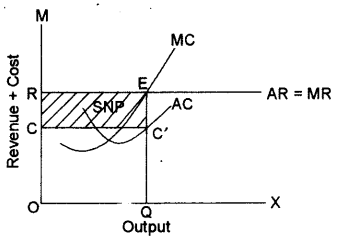
OR shows the AR curve of the firm which is equal to MR. The firm produces equilibrium output OQ at point E where MC cuts MR from below. For OQ output Average Cost (AQ) is QC’ which is less than AR for OQ output which shows that firm earns super-normal profits equal to the shaded area or area of rectangle RECC’ (Total profits). Average profits will be equal to AR-AC i.e., C’Q – EQ = EC’.
Question 5.
(a) Distinguish between monopoly and perfect competition on the basis of:
(i) AR curve.
(ii) Control over the market price.
(b) Explain the following concepts:
(i) Gross profit.
(ii) Transfer Earning of a factor.
(c) Define economic cost. Explain the relationship between total cost, total fixed cost and total variable cost with the help of a diagram.
Answer:
(a) Average Revenue curve: In monopoly competition, AR curve i.e. Demand curve is inelastic so it is a negatively sloping curve, whereas in Perfect competition as AR curve i.e. Demand curve is perfectly elastic to it is a horizontal line parallel to X-axis as shown below.
Control over market price: In monopoly competition, a monopoly firm has full control over the prices of the commodity. A monopolist is Price maker whereas, in Perfect competition, a firm can’t have any influence on the market price, it is considered price taker only.
(c) The economic cost is the sum total of both explicit and implicit cost including normal profits. Economic cost = Explicit cost + Implicit cost (including – normal profits)
Total cost refers to total obligations incurred by the firm in producing any given quantity of output. It is the sum total of all expenditure (on using both fixed and variable factors) incurred in producing a given quantity of output. In short-run total cost comprises of two parts:
(a) Total fixed cost
(b) Total variable cost
i.e., TC = TFC + TVC
Total Fixed Cost: TFC refers to the total cost incurred by the firm on the use of all fixed factors. TFC does not change with the change in output in the short-run production function. It remains the same regardless of the quantity of output. It never becomes zero even at zero levels of output. It is calculated as:
TFC = TC – TVC
where TC = Total cost
TVC = Total variable cost
Total Variable Cost: TVC refers to the total cost incurred by a firm on the use of variable factors. This cost includes payments for raw material, wages, for fuel power etc. These costs vary directly with the level of output, rising as more is produced and falling as less is produced.
TVC = TC – TFC
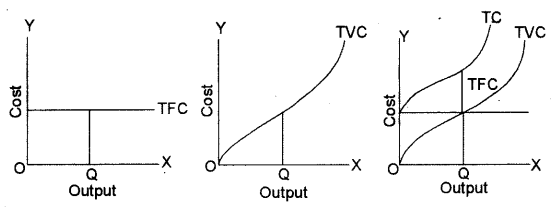
In the given diagram TC curve is obtained by adding up vertically the TFC curve and TVC curve because TC is the sum of TFC and TVC at every level of output. Since a constant FC is added to the TVC, the shape of the TC curve is same as that of TVC curve. The vertical difference between the TVC curve and the TC curve is the same at levels of output because of TFC. TVC curve starts from zero then increases at a decreasing rate first and at an increasing-rate subsequently with an increase in total output.
Question 6.
(a) Discuss two differences between intermediate goods and final goods.
(b) Distinguish between:
(i) Gross Domestic Product at market price and Net National Product at factor cost.
(ii) Personal income and personal disposable income.
(c) Calculate National Income and Net Domestic Product at market price by Income method from the following data:
| (i) Value of output | 800 Crores |
| (ii) Value of intermediate consumption | 400 Crores |
| (iii) Subsidies | 10 Crores |
| (iv) Indirect taxes | 60 Crores |
| (v) Factor income received from abroad | 10 Crores |
| (vi) Factor income paid abroad | 20 Crores |
| (vii) Mixed-income of self-employed | 120 Crores |
| (viii) Rent and royalty | 40 Crores |
| (ix) Interest and profit | 20 Crores |
| (x) Wages and salaries | 110 Crores |
| (xi) Consumption of fixed capital | 50 Crores |
| (xii) Employer’s contribution to social security | 10 Crores |
Answer:
(b) (i) GDPmp is the money value of all final goods and services produced in the domestic territory of a country in a year. It includes consumption of fixed capital and indirect taxes. It doesn’t include Net factor Income from abroad whereas NNPfc is the sum total of factor income earned by the normal residents of a country in a year. It excludes depreciation but includes net factor income from abroad. It doesn’t include net direct taxes.
(ii) GDPmp = NNPfc – NFIA + Depreciation + Net indirect tax
NNPfc = GDPmp – depreciation + NFIA – Net indirect tax
Following is the difference between Personal income and Personal Disposable Income (PDI).
Personal income is the income actually received by persons from all sources in the form of current transfer payments and factor incomes whereas PDI is the personal income remaining with individuals after paying direct personal taxes and other fees and fines to the government.
(c) National Income
NNPfc = Compensation to employees + Operating surplus + Mixed-income + NFIA.
NNPfc = (x + xii) + (viii + ix) + vii + (v – vi)
= (10 + 110) + (40 + 20) + 120 + (-10)
= ₹ 290 crore.
NDPmp = NNPfc – NFLA + Net Indirect Taxes
= 290 – (10 – 20) + (60 – 10)
= 290 + 10 + 50
= ₹ 350 crore.
Question 7.
(a) Explain how the expenditure of the Indian government has risen with reference to:
(i) Increase in developmental activities.
(ii) Increase in population.
(b) How does the fiscal policy of the government control inflation with the following tools:
(i) Public Expenditure.
(ii) Taxation.
(c) Discuss four reasons for the internal borrowing by the government.
Question 8.
(a) Mention two merits and two demerits of international trade. Explain any one merit and anyone demerit of international trade.
(b) How can the government correct an adverse balance of payments through the following measures:
(i) Export promotion.
(ii) Import control.
(c) Explain the Absolute Cost Advantage Theory of international trade with an example.
Answer:
(b) The government can correct the adverse Balance of Payment through the following measures.
Export Promotions: The Government of the country having adverse BOP stimulate exports by reducing export duties, giving subsidies and cash assistance to exporters, providing technical and marketing assistance to export-oriented units, providing facilities like quality control, arranging exhibitions of exportable goods, exempting export goods from taxes, etc. Attempts should be made to attract foreign tourist to encourage tourism. All these measures will increase the volume of exports thereby reducing the deficit in the BOP.
Import Control: To check imports, the Government can impose quota limits may increase import duties or tariffs. This will discourage imports, making BOP favourable.
Question 9.
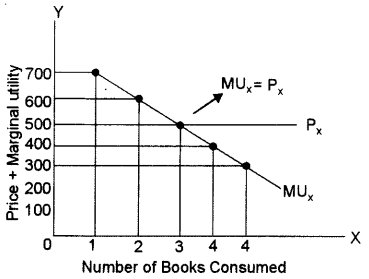
(a) The following table shows the marginal utility derived from the purchase of books. The price of the book is ₹ 500. Draw a diagram to explain consumer’s equilibrium where MU = P.
| Number of Books | M.U. |
| 1 | 700 |
| 2 | 600 |
| 3 | 500 |
| 4 | 400 |
| 5 | 300 |
(b) How is the elasticity of demand for a commodity affected by the following factors:
(i) Existence of substitutes of a commodity.
(ii) Nature of a commodity.
(c) The cost function of a firm is given below:
| Output | 0 | 1 | 2 | 3 | 4 |
| Total Cost(₹) | 60 | 80 | 100 | 111 | 116 |
Find:
(i) Total Fixed Cost.
(ii) Total Variable Cost.
(iii) Average Fixed Cost.
(iv) Average Variable Cost.
(v) Marginal Cost.
Answer:
(a) Diagram showing consumer equilibrium where MUx = Px is as below. In the diagram number of books consumed are taken on OX axis and MU and Price of the books plotted on Y-axis. As the table shows, with every additional unit of book consumed, MU derived is falling.
According to the consumer equilibrium condition, the consumer can maximize his satisfaction by consuming the units of a given commodity where MUx = Px. i.e Marginal utility derived from the consumption of a commodity is equal to the price of that commodity. In the diagram, the equilibrium situation is shown at point E, where prices (₹ 500) is equal to the Marginal utility derived (500) when the consumer consumes 3 units of Book.
(b) The elasticity of demand is affected by many factors two of them are given below:
Existence of substitutes: A commodity will have elastic demand if there are many substitutes available of the commodity, e.g, Pepsi and coca-cola, fruit. A commodity having no substitutes e.g., the salt will have inelastic demand.
Nature of the commodity: Generally the demand for necessities is inelastic and the demand for the luxuries is elastic. This is so because certain goods are essential to life which will be demanded at any price, whereas the goods meant for luxuries can be dispersed easily if they appear to be costly.
(c)

