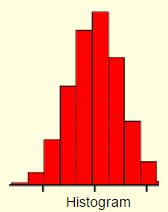
Histogram, Cumulative Frequency Histogram
There are several ways to collect and organize data.
The lesson on measures of central tendency shows an example of using a tally/frequency table. Two additional methods of organizing data are:
1) frequency histograms and
2) cumulative frequency histograms
Frequency Histogram:
A histogram is constructed from a frequency table, thus its name “frequency histogram”. The intervals from the table are placed on the x-axis and the values needed for the frequencies are represented on the y-axis. The frequencies are depicted by the height of a rectangular bar located directly above the corresponding interval.
The shapes of histograms may vary by changing the size of the intervals.
Some textbooks differentiate between histograms and bar graphs. In their definitions, a bar graph differs from a histogram in that the rectangular bars in a bar graph are separated from each other by a small gap. In histograms, the bars touch each other.

* Remember, if the interval does not start at zero, leave a space before you make the first bar. Some teachers require a symbol to be inserted to show the interval does not start at zero.
Cumulative Frequency Histogram:
The cumulative frequency is the running total of the frequencies. On a graph, it can be represented by a cumulative frequency polygon. The graph will look like a bar graph that shows the data after it has been added from the smallest interval to the largest interval.
The shape of a cumulative frequency histogram will always have the rectangular bars getting bigger as you move to the right.

Example: Start with the smallest interval (75-79)
and add. 4 + 6 = 10;
10 + 3 = 13;
13 + 2 = 15.
15 is the total number of data entries.
