Graphing Systems of Inequalities
If you can graph an inequality, you can graph a system of inequalities!
Simply graph each inequality separately on the same set of axes. The area where the shadings overlap is the solution to the system of inequalities.
To Graph a System of Inequalities
- Graph each inequality separately. The directions for graphing inequalities can be found in “Graphing Inequalities”.
- The solution to the system, will be the area where the shadings from each inequality overlap one another.
Graph the following system of inequalities
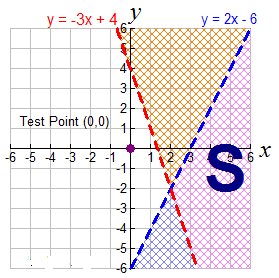
Example 1: Graph this system of linear inequalities and label the solution area S:
y < 2x – 6 and y > -3x + 4
- Replace the inequality symbols with equal signs and graph the straight lines.
y = 2x – 6 and y = -2x + 3
This problem deals with strict inequalities, so the straight lines will be drawn dashed. - Determine which side of each line will be shaded to represent its inequality. The test point (0,0) is being used in this example.
y < 2x – 6
0 < 2(0) – 6
0 < -6 False (shade the other side of the line)
y > -3x + 4
0 > -3(0) + 4
0 > 4 False (shade the other side of the line)
Find the overlapping section and label it S.

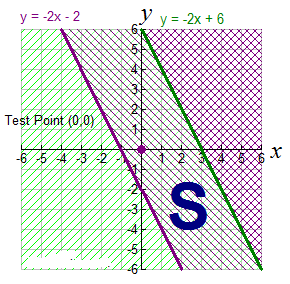
Example 2: Graph this system of linear inequalities and label the solution area S:
2x + y ≥ 2 and 2x + y ≤ 6
- Replace the inequality symbols with equal signs and graph the straight lines.
Notice that these two lines have the same slope and are parallel.
y = -2x + 2 and y = -2x + 6
This problem deals with two “less than or equal to” inequalities, so both lines are drawn solid. - Determine which side of each line will be shaded to represent its inequality. The test point (0,0) is being used in this example.
y ≥ -2x – 2
0 ≥ -2(0) – 2
0 ≥ -2 True (shade the same side of the line)
y ≤ -2x + 6
0 ≤ -2(0) + 6
0 ≤ 6 True (shade the same side of the line)
Find the overlapping section and label it S. The area between the two parallel lines is the solution.
Applied Example Using a System of Linear Inequalities
The “We Sell CDs” website plans to purchase ads in a local newspaper advertising their site. Their operating budget will allow them to spend at most 2200onthisadvertisingadventure.Theyplantorunatmost20ads.Anadwillcost50 to appear in the weekday paper and $200 to appear in a weekend edition. Prepare a graph that will represent all of the possible combinations of ads under these conditions.
Solution:
Let x = the number of weekend ads
Let y = the number of weekday ads
x + y ≤ 20 (there will be at most 20 ads)
200x + 50y ≤ 2200 (the cost of the ads at most $2200)

For this problem x and y cannot be negative numbers, so the answer will be in the first quadrant only.
Solve each of the inequalities above for the y value.
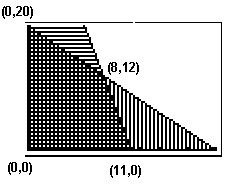
Using your graphing calculator, graph
Y1 = 20 – x (with icon set to “shade below”)
Y2 = (2200 – 200x)/50 (“shade below” icon set)
Set the window to view only the first quadrant.
Use the intersect option to find the vertices of the quadrilateral whose area makes up the pool of answers (the overlapping shaded region).
