Applying Scientific Investigations
- We study science to discover information about our environment. Professional scientists are concerned with investigations and making discoveries. Students usually study and investigate theories and discoveries already done by scientists.
- However, both students and professional scientists use the same methods for carrying out their investigations. One of the most important skills for scientific investigations is the ability to obtain information directly from the environment.
- A scientific investigator must be able to organise and record information in an effective way.
- Proper organisation of information may reveal relationships and trends, some of which may have been unsuspected at the beginning of the investigation.
- A scientific investigator must also be able to draw conclusions from the data collected.
- An observation is an important aspect of a scientific investigation. A scientific investigator makes use of the five senses which are seeing, hearing, smelling, touching and tasting, in his observation.
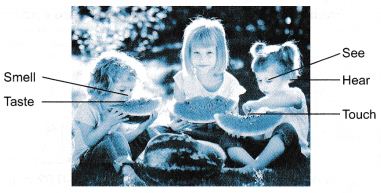
Fig. Various senses in observations - From the observation, an inference can be made. An inference is an initial interpretation or explanation concerning the observation. It is an initial conclusion concerning the observation, which may or may not be true. Further observations are required to confirm the inference.
Example 1. You probably would have observed that an ice cube melts faster in a glass of hot tea when there is more tea.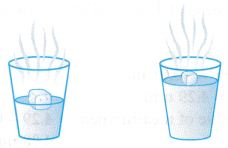 What inference can you make from this observation?
Solution:
The time taken for the ice to melt depends on the volume of the tea.
(Or, the time taken for the ice to melt depends on the mass of the tea.)
Process in a Scientific Investigation
The flow chart in Figure indicates the process in a scientific investigation.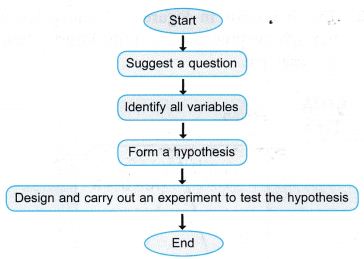 (a) When observing a certain situation, you may suggest a question suitable for a scientific investigation. The question must be well defined, measurable and controllable.
(b) To carry out a scientific investigation, you need to identify all the variables involved. A variable is a physical quantity that can be varied in an experiment. There are three types of variables.
- A manipulated variable is a physical quantity with values that are fixed by the experimenter before carrying out the experiment.
- A responding variable is a physical quantity that changes its value in response to the change in the manipulated variable.
- A fixed variable is a physical quantity that is set to remain constant throughout the experiment.
(c) You then proceed to form a hypothesis. A hypothesis is a statement of an expected outcome that usually states the relationship between the manipulated and responding variables. The hypothesis must be brief and clear and can be tested by an experiment.
(d) You will then need to design and carry out the experiment to test the hypothesis.
Carrying Out an Experiment and Writing a Report on the Experiment
When you carry out an experiment to test a hypothesis and subsequently write a report on the experiment, you need to follow the following steps.
- State the aim of the experiment. It is a statement on the relationship between the variables, as stated in the hypothesis to be tested.
- List the manipulated responding and fixed variables involved.
- List the apparatus and materials needed for the experiment.
- Draw a labelled scientific drawing of the arrangement of the apparatus.
- Write down in proper order the procedures for carrying out the experiment. The procedures should include the method of controlling the manipulated variable and the method of measuring the responding variable.
- Tabulate the data obtained from carrying out the procedures.
- Show how the data can be analysed to test whether it supports the hypothesis or not. The data can be analysed by plotting and analysing graphs, by calculations or by comparisons.
An Example of a Scientific Investigation
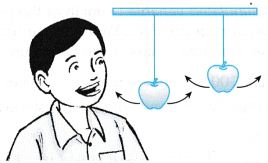
During a telematch event, Rahman was supposed to bite an apple without touching it with his hands. The apple was tied to a string and was swinging to and fro. Rahman observed that the apple took a longer time to swing to and fro if the string was longer.
The following steps will guide you through the process of scientific investigation of this example.
- Observation: The apple takes a longer time to swing to and fro when the string is longer.
- Inference: The time taken for the apple to swing to and fro depends on the length of the string.
- Question: What is the relationship between the length of the string
and the time taken for the apple to swing to and fro? - Variables: The variables involved are the length of the string, the time of the swing and the mass of the apple.
- Hypothesis: The longer the length of the string, the longer is the time taken for the apple to swing to and fro. (This hypothesis will be modified for a laboratory situation)
- Designing an experiment: The experiment designed must be able to be carried out in an ordinary school laboratory. Hence, the case of the apple swinging is equivalent to the oscillation of a simple pendulum. The time to be measured is the period of the pendulum.
Period is the time taken to complete one oscillation. For example, it is the time taken for a pendulum to swing from position A to B and back to A as shown in Figure.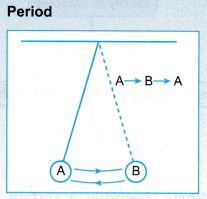
Experiment 1
Aim: To determine how the period of a simple pendulum is dependent on its length.
Problem: How is the period of a simple pendulum dependent on its length?
Inference: The period of a simple pendulum is dependent on its length.
Hypothesis: The longer the length of the pendulum, the longer is the period of its oscillation.
Variables:
(a) Manipulated variable : Length of the pendulum
(b) Responding variable : Period of the oscillation of the pendulum
(c) Fixed variable : Mass of the pendulum bob
Material: 100 cm thread, two small pieces of plywood.
Apparatus: Retort stand with clamp, stopwatch, protractor, brass bob and meter rule.
Method:
- One end of the thread is tied to a brass bob and the other end is clamped to the retort clamp with the help of two pieces of plywood as shown in Figure.
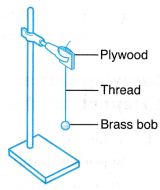
- The thread is adjusted so that from the point where it is clamped to the centre of the bob, its length l = 20.0 cm.
- The pendulum is made to oscillate at a small angle of about 10°.
- The time, t1 for 20 complete oscillations is measured. The reading is recorded.
- The time, t2 for another 20 complete oscillations is measured. The reading is recorded.
- The mean of t1 and t2 is determined and recorded as t. Subsequently, the time taken for one complete oscillation which gives the value of the period of oscillation, T is determined.
- Steps 3 to 6 are repeated for l = 30.0 cm, 40.0 cm, 50.0 cm, 60.0 cm and 70.0 cm.
- The data is recorded in Table.
- A graph of period, T against length, l is plotted.
Results:

Analysis of Data:
The graph of period, T against length, l shows a curve with a positive gradient. This means that as l increases, T also increases. Hence, the hypothesis is accepted.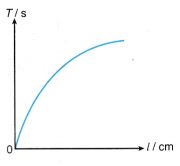 Conclusion:
The longer the length of the pendulum, the longer is the period of its oscillation. Hence, by referring back to the original observation, the experiment has proven that the longer the length of the string, the longer is the time taken for the apple to swing to and fro.
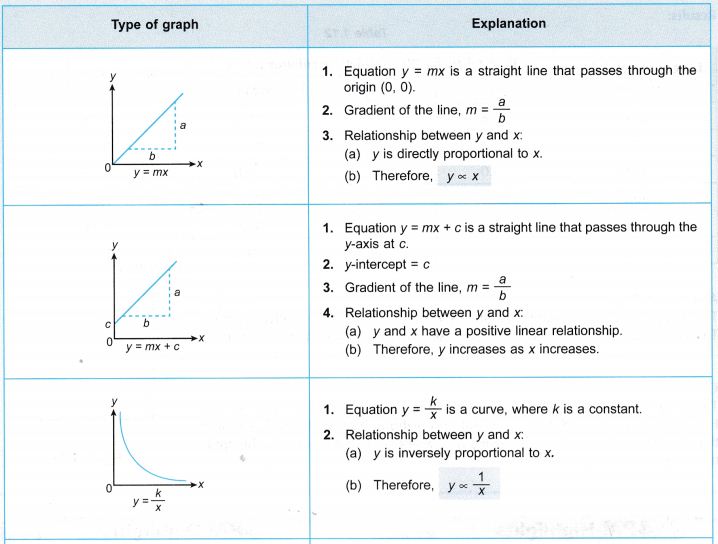
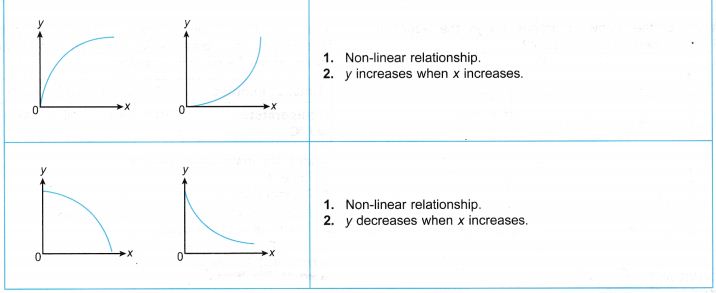
Students frequently need to analyse graphs to come out with certain conclusions especially in dealing with the relationship between two variables. Table 1.13 shows some graphs that students will usually come across in scientific investigations.
